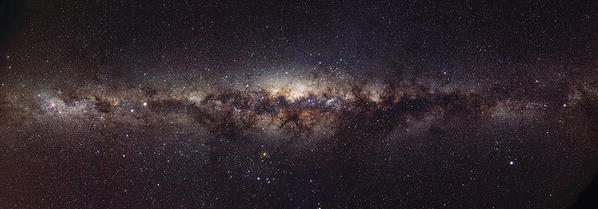
Fig. 2.1
An unusual optical image of the Milky Way:
This total view of the Galaxy is composed of a large number of
individual images. Credit: Stephan Messner
The Earth is orbiting around the Sun, which
itself is orbiting around the center of the Milky Way. Our Milky
Way, the Galaxy, is the only galaxy in which we are able to study
astrophysical processes in detail. Therefore, our journey through
extragalactic astronomy will begin in our home Galaxy, with which
we first need to become familiar before we are ready to take off
into the depths of the Universe. Knowing the properties of the
Milky Way is indispensable for understanding other galaxies.
2.1 Galactic coordinates
On a clear night, and sufficiently far away from
cities, one can see the magnificent band of the Milky Way on the
sky (Fig. 2.1). This observation suggests that the
distribution of light, i.e., that of the stars in the Galaxy is
predominantly that of a thin disk, as is also clearly seen in
Fig. 1.52. A detailed analysis of the
geometry of the distribution of stars and gas confirms this
impression. This geometry of the Galaxy suggests the introduction
of two specially adapted coordinate systems which are particularly
convenient for quantitative descriptions.
Spherical Galactic
coordinates (ℓ,b). We consider a spherical coordinate
system, with its center being “here”, at the location of the Sun
(see Fig. 2.2). The Galactic plane is the plane of the
Galactic disk, i.e., it is parallel to the band of the Milky Way.
The two Galactic coordinates
ℓ and b are angular
coordinates on the sphere. Here, b denotes the Galactic latitude , the angular
distance of a source from the Galactic plane, with ![$$b \in [-90^{\circ },+90^{\circ }]$$](A129044_2_En_2_Chapter_IEq1.gif) . The great circle
b = 0∘ is then
located in the plane of the Galactic disk. The direction
b = 90∘ is
perpendicular to the disk and denotes the North Galactic Pole (NGP)
, while
. The great circle
b = 0∘ is then
located in the plane of the Galactic disk. The direction
b = 90∘ is
perpendicular to the disk and denotes the North Galactic Pole (NGP)
, while  marks the direction to the South
Galactic Pole (SGP). The second angular coordinate is the
Galactic longitude
ℓ, with ℓ ∈ [0∘, 360∘].
It measures the angular separation between the position of a
source, projected perpendicularly onto the Galactic disk (see
Fig. 2.2), and
the Galactic center, which itself has angular coordinates
b = 0∘ and
ℓ = 0∘. Given
ℓ and b for a source, its location on the sky
is fully specified. In order to specify its three-dimensional
location, the distance of that source from us is alsoneeded.
marks the direction to the South
Galactic Pole (SGP). The second angular coordinate is the
Galactic longitude
ℓ, with ℓ ∈ [0∘, 360∘].
It measures the angular separation between the position of a
source, projected perpendicularly onto the Galactic disk (see
Fig. 2.2), and
the Galactic center, which itself has angular coordinates
b = 0∘ and
ℓ = 0∘. Given
ℓ and b for a source, its location on the sky
is fully specified. In order to specify its three-dimensional
location, the distance of that source from us is alsoneeded.
. The great circle
b = 0∘ is then
located in the plane of the Galactic disk. The direction
b = 90∘ is
perpendicular to the disk and denotes the North Galactic Pole (NGP)
, while marks the direction to the South
Galactic Pole (SGP). The second angular coordinate is the
Galactic longitude
ℓ, with ℓ ∈ [0∘, 360∘].
It measures the angular separation between the position of a
source, projected perpendicularly onto the Galactic disk (see
Fig. 2.2), and
the Galactic center, which itself has angular coordinates
b = 0∘ and
ℓ = 0∘. Given
ℓ and b for a source, its location on the sky
is fully specified. In order to specify its three-dimensional
location, the distance of that source from us is alsoneeded.The conversion of the positions of sources given
in Galactic coordinates (b, ℓ) to that in equatorial coordinates
(α, δ) and vice versa is obtained from the
rotation between these two coordinate systems, and is described by
spherical trigonometry. 1 The necessary formulae can be found
in numerous standard texts. We will not reproduce them here, since
nowadays this transformation is done nearly exclusively using
computer programs. Instead, we will give some examples. The
following figures refer to the Epoch 2000: due to the precession of
the rotation axis of the Earth, the equatorial coordinate system
changes with time, and is updated from time to time. The position
of the Galactic center (at  ) is α = 17h45. 6m,
 in
equatorial coordinates. This immediately implies that at the La
Silla Observatory, located at geographic latitude − 29∘,
the Galactic center is found near the zenith at local midnight in
May/June. Because of the high stellar density in the Galactic disk
and the large extinction due to dust this is therefore not a good
season for extragalactic observations from La Silla. The North
Galactic Pole has coordinates
in
equatorial coordinates. This immediately implies that at the La
Silla Observatory, located at geographic latitude − 29∘,
the Galactic center is found near the zenith at local midnight in
May/June. Because of the high stellar density in the Galactic disk
and the large extinction due to dust this is therefore not a good
season for extragalactic observations from La Silla. The North
Galactic Pole has coordinates  ,
,
 .
.
) is α = 17h45. 6m,
in
equatorial coordinates. This immediately implies that at the La
Silla Observatory, located at geographic latitude − 29∘,
the Galactic center is found near the zenith at local midnight in
May/June. Because of the high stellar density in the Galactic disk
and the large extinction due to dust this is therefore not a good
season for extragalactic observations from La Silla. The North
Galactic Pole has coordinates ,
.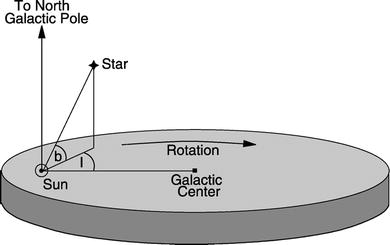
Fig. 2.2
The Sun is at the origin of the Galactic
coordinate system. The directions to the Galactic center and to the
North Galactic Pole (NGP) are indicated and are located at
ℓ = 0∘ and
b = 0∘, and at
b = 90∘,
respectively. Adopted from: B.W. Carroll & D.A. Ostlie 1996,
Introduction to Modern
Astrophysics, Addison-Wesley
Zone of
Avoidance.
As already mentioned, the absorption by dust and
the presence of numerous bright stars render optical observations
of extragalactic sources in the direction of the disk difficult.
The best observing conditions are found at large | b | , while it is very hard to do
extragalactic astronomy in the optical regime at | b | ≲ 10∘; this region is
therefore often called the ‘Zone of Avoidance’ . An illustrative
example is the galaxy Dwingeloo 1, which was already mentioned in
Sect. 1.1 (see Fig. 1.9). This galaxy was only
discovered in the 1990s despite being in our immediate vicinity: it
is located at low | b | ,
right in the Zone of Avoidance. As mentioned before, one of the
prime motivations for carrying out the 2MASS survey (see
Sect. 1.4) was to ‘peek’ through the dust
in the Zone of Avoidance by observing in the near-IR bands.
Cylindrical
Galactic coordinates (R, θ,z).
The angular coordinates introduced above are well
suited to describing the angular position of a source relative to
the Galactic disk. However, we will now introduce another
three-dimensional coordinate system for the description of the
Milky Way geometry that will prove very convenient in the study of
its kinematic and dynamic properties. It is a cylindrical
coordinate system, with the Galactic center at the origin (see also
Fig. 2.22
below). The radial coordinate R measures the distance of an object
from the Galactic center in the disk, and z specifies the height above the disk
(objects with negative z
are thus located below the Galactic disk, i.e., south of it). For
instance, the Sun has a distance from the Galactic center of
R = R 0 ≈ 8 kpc. The angle
θ specifies the angular
separation of an object in the disk relative to the position of the
Sun, as seen from the Galactic center. The distance of an object
with coordinates R, θ, z from the Galactic center is then
 , independent of θ. If the matter distribution in the
Milky Way was axially symmetric, the density would then depend only
on R and z, but not on θ. Since this assumption is a good
approximation, this coordinate system is very well suited for the
physical description of the Galaxy.
, independent of θ. If the matter distribution in the
Milky Way was axially symmetric, the density would then depend only
on R and z, but not on θ. Since this assumption is a good
approximation, this coordinate system is very well suited for the
physical description of the Galaxy.
, independent of θ. If the matter distribution in the
Milky Way was axially symmetric, the density would then depend only
on R and z, but not on θ. Since this assumption is a good
approximation, this coordinate system is very well suited for the
physical description of the Galaxy.2.2 Determination of distances within our Galaxy
A central problem in astronomy is the estimation
of distances. The position of sources on the sphere gives us a
two-dimensional picture. To obtain three-dimensional information,
measurements of distances are required. We need to know the
distance to a source if we want to draw conclusions about its
physical parameters. For example, we can directly observe the
angular diameter of an object, but to derive the physical size we
need to know its distance. Another example is the determination of
the luminosity L of a
source, which can be derived from the observed flux S only by means of its distance
D, using

(2.1)
It is useful to consider the dimensions of the
physical parameters in this equation. The unit of the luminosity is
![$$[L] = \mathrm{erg}\,\mathrm{s}^{-1}$$](A129044_2_En_2_Chapter_IEq8.gif) , and that of
the flux
, and that of
the flux ![$$[S] = \mathrm{erg}\,\mathrm{s}^{-1}\,\mathrm{cm}^{-2}$$](A129044_2_En_2_Chapter_IEq9.gif) .
The flux is the energy passing through a unit area per unit time
(see Appendix A). Of course, the physical properties of a
source are characterized by the luminosity L and not by the flux S, which depends on its distance from
the Sun.
.
The flux is the energy passing through a unit area per unit time
(see Appendix A). Of course, the physical properties of a
source are characterized by the luminosity L and not by the flux S, which depends on its distance from
the Sun.
, and that of
the flux .
The flux is the energy passing through a unit area per unit time
(see Appendix A). Of course, the physical properties of a
source are characterized by the luminosity L and not by the flux S, which depends on its distance from
the Sun.Here we will review various methods for the
estimation of distances of objects in our Milky Way, postponing the
discussion of methods for estimating extragalactic distances to
Sect. 3.9.

Fig. 2.3
Illustration of the parallax effect: in the
course of the Earth’s orbit around the Sun the apparent positions
of nearby stars on the sky seem to change relative to those of very
distant background sources
2.2.1 Trigonometric parallax
The most important method of distance
determination is the trigonometric
parallax, not only from a historical point-of-view. This
method is based on a purely geometric effect and is therefore
independent of any physical assumptions. Due to the motion of the
Earth around the Sun the positions of nearby stars on the sphere
change relative to those of very distant sources (e.g.,
extragalactic objects such as quasars). The latter therefore define
a fixed reference frame on the sphere (see Fig. 2.3). In the course of a
year the apparent position of a nearby star follows an ellipse on
the sphere, the semi-major axis of which is called the parallax p.2 The axis ratio of this ellipse
depends on the direction of the star relative to the ecliptic (the
plane that is defined by the orbits of the Earth and the other
planets) and is of no further interest here. The parallax depends
on the radius r of the
Earth’s orbit, hence on the Earth-Sun distance which is, by
definition, one astronomical unit.3 Furthermore, the parallax depends on
the distance D of the star,
 where we used p ≪ 1 in the
last step, and p is
measured in radians as usual. The trigonometric parallax is also
used to define the common unit of distance in astronomy: one
parsec (pc) is the distance
of a hypothetical source for which the parallax is exactly
p = 1″. With the conversion
of arcseconds to radians (1″ ≈ 4. 848 × 10−6 radians)
one gets
where we used p ≪ 1 in the
last step, and p is
measured in radians as usual. The trigonometric parallax is also
used to define the common unit of distance in astronomy: one
parsec (pc) is the distance
of a hypothetical source for which the parallax is exactly
p = 1″. With the conversion
of arcseconds to radians (1″ ≈ 4. 848 × 10−6 radians)
one gets  , which for a parsec yields
 The distance corresponding to a measured parallax is then
calculated as
The distance corresponding to a measured parallax is then
calculated as

(2.2)
, which for a parsec yields
(2.3)
(2.4)
To determine the parallax p, precise measurements of the position
of an object at different times are needed, spread over a year,
allowing us to measure the ellipse drawn on the sphere by the
object’s apparent position. For ground-based observations the
accuracy of this method is limited by the atmosphere. The seeing
causes a blurring of the images of astronomical sources and thus
limits the accuracy of position measurements. From the ground this
method is therefore limited to parallaxes larger than ≈ 0.
′ ′ 01, implying
that the trigonometric parallax yields distances to stars only
within ∼ 30 pc.
An extension of this method towards smaller
p, and thus larger
distances, became possible with the astrometric satellite Hipparcos
. It operated between November 1989 and March 1993 and measured the
positions and trigonometric parallaxes of about 120 000 bright
stars, with a precision of ∼ 0. ′ ′ 001 for the brighter targets.
With Hipparcos the method of trigonometric parallax could be
extended to stars up to distances of ∼ 300 pc. The satellite Gaia ,
the successor mission to Hipparcos, was launched on Dec. 19, 2013.
Gaia will compile a catalog of ∼ 109 stars up to
V ≈ 20 in four broad-band
and eleven narrow-band filters. It will measure parallaxes for
these stars with an accuracy of ∼ 2 × 10⁻⁴ arcsec, and a
considerably better accuracy for the brightest stars. Gaia will
thus determine the distances for ∼ 2 × 10⁸ stars with a
precision of 10 %, and tangential velocities (see next section)
with a precision of better than 3 km∕s.
The trigonometric parallax method forms the basis
of nearly all distance determinations owing to its purely
geometrical nature. For example, using this method the distances to
nearby stars have been determined, allowing the production of the
Hertzsprung–Russell diagram (see Appendix B.2). Hence, all
distance measures that are based on the properties of stars, such
as will be described below, are calibrated by the trigonometric
parallax.
2.2.2 Proper motions
Stars are moving relative to us or, more
precisely, relative to the Sun. To study the kinematics of the
Milky Way we need to be able to measure the velocities of stars.
The radial component v
r of the velocity is easily obtained from the Doppler
shift of spectral lines,
 where λ 0 is the
rest-frame wavelength of an atomic transition and
where λ 0 is the
rest-frame wavelength of an atomic transition and  the Doppler shift of the wavelength due to the radial velocity of
the source. The sign of the radial velocity is defined such that
v r > 0
corresponds to a motion away from us, i.e., to a redshift of
spectral lines.
the Doppler shift of the wavelength due to the radial velocity of
the source. The sign of the radial velocity is defined such that
v r > 0
corresponds to a motion away from us, i.e., to a redshift of
spectral lines.
(2.5)
the Doppler shift of the wavelength due to the radial velocity of
the source. The sign of the radial velocity is defined such that
v r > 0
corresponds to a motion away from us, i.e., to a redshift of
spectral lines.In contrast, the determination of the other two
velocity components is much more difficult. The tangential
component, v t,
of the velocity can be obtained from the proper motion of an object. In addition
to the motion caused by the parallax, stars also change their
positions on the sphere as a function of time because of the
transverse component of their velocity relative to the Sun. The
proper motion μ is thus an
angular velocity, e.g., measured in milliarcseconds per year
(mas/yr). This angular velocity is linked to the tangential
velocity component via
 Therefore, one can calculate the tangential velocity from the
proper motion and the distance. If the latter is derived from the
trigonometric parallax, (2.6) and (2.4) can be combined to
yield
Therefore, one can calculate the tangential velocity from the
proper motion and the distance. If the latter is derived from the
trigonometric parallax, (2.6) and (2.4) can be combined to
yield
 Hipparcos measured proper motions for ∼ 105 stars with
an accuracy of up to a few mas/yr; however, they can be translated
into physical velocities only if their distance is known.
Hipparcos measured proper motions for ∼ 105 stars with
an accuracy of up to a few mas/yr; however, they can be translated
into physical velocities only if their distance is known.
(2.6)
(2.7)
Of course, the proper motion has two components,
corresponding to the absolute value of the angular velocity and its
direction on the sphere. Together with v r this determines the
three-dimensional velocity vector. Correcting for the known
velocity of the Earth around the Sun, one can then compute the
velocity vector  of the star relative to the Sun,
called the heliocentric
velocity .
of the star relative to the Sun,
called the heliocentric
velocity .
of the star relative to the Sun,
called the heliocentric
velocity .2.2.3 Moving cluster parallax
The stars in an (open) star cluster all have a
very similar spatial velocity. This implies that their proper
motion vectors should be similar. To what accuracy the proper
motions are aligned depends on the angular extent of the star
cluster on the sphere. Like two railway tracks that run parallel
but do not appear parallel to us, the vectors of proper motions in
a star cluster also do not appear parallel. They are directed
towards a convergence point, as depicted in Fig. 2.4. We shall demonstrate
next how to use this effect to determine the distance to a star
cluster.

Fig. 2.4
The moving cluster parallax is a projection
effect, similar to that known from viewing railway tracks. The
directions of velocity vectors pointing away from us seem to
converge and intersect at the convergence point. The connecting
line from the observer to the convergence point is parallel to the
velocity vector of the star cluster
We consider a star cluster and assume that all
stars have the same spatial velocity  . The position of the i-th star as a function of time is then
described by
. The position of the i-th star as a function of time is then
described by
 where
where  is the current position if we
identify the origin of time, t = 0, with ‘today’. The direction of a
star relative to us is described by the unit vector
is the current position if we
identify the origin of time, t = 0, with ‘today’. The direction of a
star relative to us is described by the unit vector
 From this, one infers that for large times, t → ∞, the direction vectors are identical
for all stars in the cluster,
From this, one infers that for large times, t → ∞, the direction vectors are identical
for all stars in the cluster,

. The position of the i-th star as a function of time is then
described by
(2.8)
is the current position if we
identify the origin of time, t = 0, with ‘today’. The direction of a
star relative to us is described by the unit vector
(2.9)
(2.10)
Hence for large times all stars will appear at
the same point  : the convergence
point. This only depends on the direction of the velocity vector of
the star cluster. In other words, the direction vector of the
stars is such that they are all moving towards the convergence
point. Thus,
: the convergence
point. This only depends on the direction of the velocity vector of
the star cluster. In other words, the direction vector of the
stars is such that they are all moving towards the convergence
point. Thus,  (and hence
 ) can be
measured from the direction of the proper motions of the stars in
the cluster. On the other hand, one component of
) can be
measured from the direction of the proper motions of the stars in
the cluster. On the other hand, one component of  can be determined from the (easily
measured) radial velocity v
r. With these two observables the three-dimensional
velocity vector
can be determined from the (easily
measured) radial velocity v
r. With these two observables the three-dimensional
velocity vector  is completely determined, as is
easily demonstrated: let ψ
be the angle between the line-of-sight
is completely determined, as is
easily demonstrated: let ψ
be the angle between the line-of-sight  towards a star in the cluster and
 . The angle ψ is directly read off from the
direction vector
. The angle ψ is directly read off from the
direction vector  and the convergence point,
 .
With
.
With  one then
obtains
one then
obtains
 and so

: the convergence
point. This only depends on the direction of the velocity vector of
the star cluster. In other words, the direction vector of the
stars is such that they are all moving towards the convergence
point. Thus, (and hence
) can be
measured from the direction of the proper motions of the stars in
the cluster. On the other hand, one component of can be determined from the (easily
measured) radial velocity v
r. With these two observables the three-dimensional
velocity vector is completely determined, as is
easily demonstrated: let ψ
be the angle between the line-of-sight towards a star in the cluster and
. The angle ψ is directly read off from the
direction vector and the convergence point,
.
With one then
obtains
(2.11)
This means that the tangential velocity
v t can be
measured without determining the distance to the stars in the
cluster. On the other hand, (2.6) defines a relation
between the proper motion, the distance, and v t. Hence, a distance
determination for the star is now possible with

(2.12)
This method yields accurate distance estimates of
star clusters within ∼ 200 pc. The accuracy depends on the
measurability of the proper motions. Furthermore, the cluster
should cover a sufficiently large area on the sky for the
convergence point to be well defined. For the distance estimate,
one can then take the average over a large number of stars in the
cluster if one assumes that the spatial extent of the cluster is
much smaller than its distance to us. Targets for applying this
method are the Hyades, a cluster of about 200 stars at a mean
distance of D ≈ 45 pc, the
Ursa-Major group of about 60 stars at D ≈ 24 pc, and the Pleiades with about
600 stars at D ≈ 130 pc.
Historically the distance determination to the
Hyades, using the moving cluster parallax, was extremely important
because it defined the scale to all other, larger distances. Its
constituent stars of known distance are used to construct a
calibrated Hertzsprung–Russell diagram which forms the basis for
determining the distance to other star clusters, as will be
discussed in Sect. 2.2.4. In other words, it is the lowest rung of
the so-called distance ladder that we will discuss in
Sect. 3.9. With Hipparcos, however, the
distance to the Hyades stars could also be measured using the
trigonometric parallax, yielding more accurate values. Hipparcos
was even able to differentiate the ‘near’ from the ‘far’ side of
the cluster—this star cluster is too close for the assumption of an
approximately equal distance of all its stars to be still valid. A
recent value for the mean distance of theHyades is

(2.13)
2.2.4 Photometric distance; extinction and reddening
Most stars in the color-magnitude diagram are
located along the main sequence. This enables us to compile a
calibrated main sequence of those stars whose trigonometric
parallaxes are measured, thus with known distances. Utilizing
photometric methods, it is then possible to derive the distance to
a star cluster, as we will demonstrate in the following.
The stars of a star cluster define their own main
sequence (color-magnitude diagrams for some star clusters are
displayed in Fig. 2.5); since they are all located at the same
distance, their main sequence is already defined in a
color-magnitude diagram in which only apparent magnitudes are
plotted. This cluster main sequence can then be fitted to a
calibrated main sequence4 by a suitable choice of the distance,
i.e., by adjusting the distance modulus m − M,
 where m and M denote the apparent and absolute
magnitude, respectively.
where m and M denote the apparent and absolute
magnitude, respectively.

Fig. 2.5
Color-magnitude diagram (CMD) for different
star clusters. Such a diagram can be used for the distance
determination of star clusters because the absolute magnitudes of
main sequence stars are known (by calibration with nearby clusters,
especially the Hyades). One can thus determine the distance modulus
by vertically ‘shifting’ the main sequence. Also, the age of a star
cluster can be estimated from a CMD: luminous main sequence stars
have a shorter lifetime on the main sequence than less luminous
ones. The turn-off point in the stellar sequence away from the main
sequence therefore corresponds to that stellar mass for which the
lifetime on the main sequence equals the age of the star cluster.
Accordingly, the age is specified on the right axis as a function
of the position of the turn-off point; the Sun will leave the main
sequence after about 10 × 109 yr. Credit: Allan Sandage,
Carnegie
In reality this method cannot be applied so
easily since the position of a star on the main sequence does not
only depend on its mass but also on its age and metallicity.
Furthermore, only stars of luminosity class V (i.e., dwarf stars)
define the main sequence, but without spectroscopic data it is not
possible to determine the luminosity class.
Extinction and
reddening. Another major problem is extinction . Absorption
and scattering of light by dust affect the relation of absolute to
apparent magnitude: for a given M, the apparent magnitude m becomes larger (fainter) in the case
of absorption, making the source appear dimmer. Also, since
extinction depends on wavelength, the spectral energy distribution
of the source is modified and the observed color of the star
changes. Because extinction by dust is always associated with such
a change in color, one can estimate the absorption—provided one has
sufficient information on the intrinsic color of a source or of an
ensemble of sources. We will now show how this method can be used
to estimate the distance to a star cluster.
We consider the equation of radiative transfer
for pure absorption or scattering (see Appendix A),
 where I ν denotes the specific intensity
at frequency ν,
κ ν the absorption coefficient, and
s the distance coordinate
along the light beam. The absorption coefficient has the dimension
of an inverse length. Equation (2.14) says that the
amount by which the intensity of a light beam is diminished on a
path of length ds is
proportional to the original intensity and to the path length
ds. The absorption
coefficient is thus defined as the constant of proportionality. In
other words, on the distance interval ds, a fraction κ ν ds of all photons at frequency
ν is absorbed or scattered
out of the beam. The solution of the transport
equation (2.14) is obtained by writing it in the form
where I ν denotes the specific intensity
at frequency ν,
κ ν the absorption coefficient, and
s the distance coordinate
along the light beam. The absorption coefficient has the dimension
of an inverse length. Equation (2.14) says that the
amount by which the intensity of a light beam is diminished on a
path of length ds is
proportional to the original intensity and to the path length
ds. The absorption
coefficient is thus defined as the constant of proportionality. In
other words, on the distance interval ds, a fraction κ ν ds of all photons at frequency
ν is absorbed or scattered
out of the beam. The solution of the transport
equation (2.14) is obtained by writing it in the form
 and integrating from 0 to s,
 where in the last step we defined the optical depth , τ ν , which depends on frequency.
This yields
where in the last step we defined the optical depth , τ ν , which depends on frequency.
This yields

(2.14)
and integrating from 0 to s,
(2.15)
The specific intensity is thus reduced by a
factor e−τ
compared to the case of no absorption taking place. Accordingly,
for the flux we obtain
 where S ν is the flux measured by the
observer at a distance s
from the source, and S
ν (0) is the
flux of the source without absorption. Because of the relation
between flux and magnitude
where S ν is the flux measured by the
observer at a distance s
from the source, and S
ν (0) is the
flux of the source without absorption. Because of the relation
between flux and magnitude  , or S ∝ 10−0. 4m , one has
 or
or
 Here, A ν is the extinction coefficient describing the
change of apparent magnitude m compared to that without absorption,
m 0. Since the
absorption coefficient κ
ν depends on
frequency, absorption is always linked to a change in color. This
is described by the color
excess which is defined as follows:
Here, A ν is the extinction coefficient describing the
change of apparent magnitude m compared to that without absorption,
m 0. Since the
absorption coefficient κ
ν depends on
frequency, absorption is always linked to a change in color. This
is described by the color
excess which is defined as follows:
 The color excess describes the change of the color index
(X − Y ), measured in two filters
X and Y that define the corresponding
spectral windows by their transmission curves. The ratio
The color excess describes the change of the color index
(X − Y ), measured in two filters
X and Y that define the corresponding
spectral windows by their transmission curves. The ratio
 depends only on the optical properties of the dust or, more
specifically, on the ratio of the absorption coefficients in the
two frequency bands X and
Y considered here. Thus,
the color excess is proportional to the extinction coefficient,
depends only on the optical properties of the dust or, more
specifically, on the ratio of the absorption coefficients in the
two frequency bands X and
Y considered here. Thus,
the color excess is proportional to the extinction coefficient,
 where in the last step we introduced the factor of proportionality
R X between the extinction
coefficient and the color excess, which depends only on the
properties of the dust and the choice of the filters. Usually, one
considers a blue and a visual filter (see Appendix A.4.2 for a
description of the filters commonly used) and writes
where in the last step we introduced the factor of proportionality
R X between the extinction
coefficient and the color excess, which depends only on the
properties of the dust and the choice of the filters. Usually, one
considers a blue and a visual filter (see Appendix A.4.2 for a
description of the filters commonly used) and writes
 For example, for dust in our Milky Way we have the characteristic
relation
For example, for dust in our Milky Way we have the characteristic
relation

(2.16)
, or S ∝ 10−0. 4m , one has
(2.17)
(2.18)
depends only on the optical properties of the dust or, more
specifically, on the ratio of the absorption coefficients in the
two frequency bands X and
Y considered here. Thus,
the color excess is proportional to the extinction coefficient,
(2.19)
(2.20)
(2.21)

Fig. 2.6
Wavelength dependence of the extinction
coefficient A
ν , normalized
to the extinction coefficient A I at  .
Different kinds of clouds, characterized by the value of
R V , i.e., by the reddening law,
are shown. On the x-axis
the inverse wavelength is plotted, so that the frequency increases
to the right. The solid
curve specifies the mean Galactic extinction curve. The
extinction coefficient, as determined from the observation of an
individual star, is also shown; clearly the observed law deviates
from the model in some details. The figure insert shows a detailed plot at
relatively large wavelengths in the NIR range of the spectrum; at
these wavelengths the extinction depends only weakly on the value
of R V . Source: B. Draine 2003,
Interstellar Dust Grains,
ARA&A 41, 241. Reprinted, with permission, from the
Annual Review of Astronomy &
Astrophysics, Volume 41 ©2003 by Annual Reviews www.annualreviews.org
.
Different kinds of clouds, characterized by the value of
R V , i.e., by the reddening law,
are shown. On the x-axis
the inverse wavelength is plotted, so that the frequency increases
to the right. The solid
curve specifies the mean Galactic extinction curve. The
extinction coefficient, as determined from the observation of an
individual star, is also shown; clearly the observed law deviates
from the model in some details. The figure insert shows a detailed plot at
relatively large wavelengths in the NIR range of the spectrum; at
these wavelengths the extinction depends only weakly on the value
of R V . Source: B. Draine 2003,
Interstellar Dust Grains,
ARA&A 41, 241. Reprinted, with permission, from the
Annual Review of Astronomy &
Astrophysics, Volume 41 ©2003 by Annual Reviews www.annualreviews.orgThis relation is not a universal law, but the
factor of proportionality depends on the properties of the dust.
They are determined, e.g., by the chemical composition and the size
distribution of the dust grains. Figure 2.6 shows the wavelength
dependence of the extinction coefficient for different kinds of
dust, corresponding to different values of R V . In the optical part of the
spectrum we have approximately τ ν ∝ ν, i.e., blue light is absorbed (or
scattered) more strongly than red light. The extinction therefore
always causes a reddening.5

Fig. 2.7
The column density of neutral hydrogen
along the line-of-sight to Galactic stars, plotted as a function of
the corresponding color excess E(B − V ), as shown by the points. The
dashed line is the
best-fitting linear relation as given by (2.22). The other symbols correspond to
measurements of both quantities in distant galaxies and will be
discussed in Sect. 3.11.4. Source: X. Dai & C.S.
Kochanek 2009, Differential X-Ray
Absorption and Dust-to-Gas Ratios of the Lens Galaxies SBS
0909+523, FBQS 0951+2635, and B 1152+199, ApJ 692, 677, p.
682, Fig. 5. ©AAS. Reproduced with permission
The extinction coefficient A V is proportional to the optical
depth towards a source, see (2.17), and according
to (2.21), so is the color excess. Since the
extinction is due to dust along the line-of-sight, the color excess
is proportional to the column density of dust towards the source.
If we assume that the dust-to-gas ratio in the interstellar medium
does not vary greatly, we expect that the column density of neutral
hydrogen N H is
proportional to the color excess. The former can be measured from
the Lyman-α absorption in
the spectra of stars, whereas the latter is obtained by comparing
the observed color of these stars with the color expected for the
type of star, given its spectrum (and thus, its spectral
classification). One finds indeed that the color excess is
proportional to the Hi
column density (see Fig. 2.7), with
 and a scatter of about 30 % around this relation. The fact that
this scatter is so small indicates that the assumption of a
constant dust-to-gas ratio is reasonable.
and a scatter of about 30 % around this relation. The fact that
this scatter is so small indicates that the assumption of a
constant dust-to-gas ratio is reasonable.
(2.22)
In the Solar neighborhood the extinction
coefficient for sources in the disk is about
 but this relation is at best a rough approximation, since the
absorption coefficient can show strong local deviations from this
law, for instance in the direction of molecular clouds (see, e.g.,
Fig. 2.8).
but this relation is at best a rough approximation, since the
absorption coefficient can show strong local deviations from this
law, for instance in the direction of molecular clouds (see, e.g.,
Fig. 2.8).
(2.23)
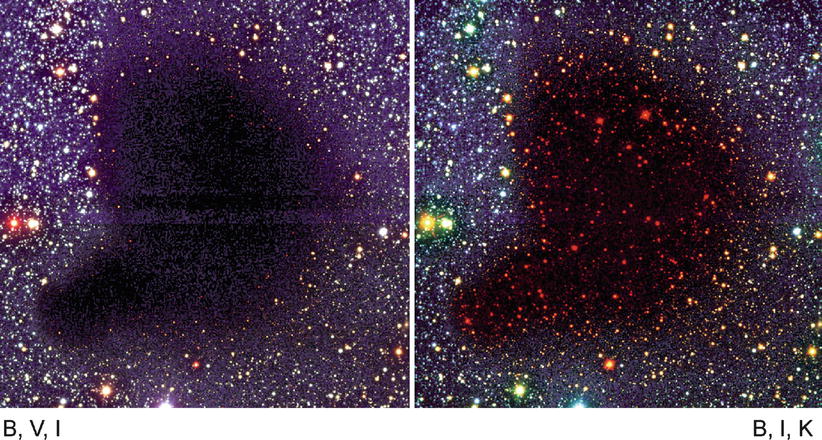
Fig. 2.8
These images of the molecular cloud Barnard
68 show the effects of extinction and reddening: the left image is a composite of exposures
in the filters B, V, and I. At the center of the cloud essentially
all the light from the background stars is absorbed. Near the edge
it is dimmed and visibly shifted to the red. In the right-hand image observations in the
filters B, I, and K have been combined (red is assigned here to the
near-infrared K-band filter); we can clearly see that the cloud is
more transparent at longer wavelengths. Credit: European Southern
Observatory
Color-color
diagram.
We now return to the distance determination for a
star cluster. As a first step in this measurement, it is necessary
to determine the degree of extinction, which can only be done by
analyzing the reddening. The stars of the cluster are plotted in a
color-color diagram, for
example by plotting the colors (U − B) and (B − V ) on the two axes (see
Fig. 2.9). A
color-color diagram also shows a main sequence along which the
majority of the stars are aligned. The wavelength-dependent
extinction causes a reddening in
both colors. This shifts the positions of the stars in the
diagram. The direction of the reddening vector depends only on the
properties of the dust and is here assumed to be known, whereas the
amplitude of the shift
depends on the extinction coefficient. In a similar way to the CMD,
this amplitude can now be determined if one has access to a
calibrated, unreddened main sequence for the color-color diagram
which can be obtained from the examination of nearby stars. From
the relative shift of the main sequence in the two diagrams one can
then derive the reddening and thus the extinction. The essential
point here is the fact that the
color-color diagram is independent of the distance.

Fig. 2.9
Color-color diagram for main sequence
stars. Spectral types and absolute magnitudes are specified along
the lower curve. The
upper curve shows the
location of black bodies in the color-color diagram, with the
temperature in units of 103 K labeled along the curve.
Interstellar reddening shifts the measured stellar locations
parallel to the reddening vector indicated by the arrow. Source: A. Unsöld & B.
Baschek, The New Cosmos,
Springer-Verlag
This then defines the procedure for the distance
determination of a star cluster using photometry: in the first step
we determine the reddening E(B − V ), and thus with (2.21) also A V , by shifting the main sequence
in a color-color diagram along the reddening vector until it
matches a calibrated main sequence. In the second step the distance
modulus is determined by vertically (i.e., in the direction of
M) shifting the main
sequence in the color-magnitude diagram until it matches a
calibrated main sequence. From this, the distance is finally
obtained according to

(2.24)
2.2.5 Spectroscopic distance
From the spectrum of a star, the spectral type as
well as its luminosity class can be obtained. The former is
determined from the strength of various absorption lines in the
spectrum, while the latter is obtained from the width of the lines.
From the line width the surface gravity of the star can be derived,
and from that its radius (more precisely, M∕R 2). The spectral type and
the luminosity class specify the position of the star in the HRD
unambiguously. By means of stellar evolution models, the absolute
magnitude M
V can then be
determined. Furthermore, the comparison of the observed color with
that expected from theory yields the color excess E(B − V ), and from that we obtain
A V . With this information we are
then able to determine the distance using

(2.25)
2.2.6 Distances of visual binary stars
Kepler’s third law for a two-body problem,
 relates the orbital period P of a binary star to the masses
m i of the two components and the
semi-major axis a of the
ellipse. The latter is defined by the separation vector between the
two stars in the course of one period. This law can be used to
determine the distance to a visual binary star. For such a system,
the period P and the
angular diameter 2θ of the
orbit are direct observables. If one additionally knows the mass of
the two stars, for instance from their spectral classification,
a can be determined
according to (2.26), and from this the distance follows with
relates the orbital period P of a binary star to the masses
m i of the two components and the
semi-major axis a of the
ellipse. The latter is defined by the separation vector between the
two stars in the course of one period. This law can be used to
determine the distance to a visual binary star. For such a system,
the period P and the
angular diameter 2θ of the
orbit are direct observables. If one additionally knows the mass of
the two stars, for instance from their spectral classification,
a can be determined
according to (2.26), and from this the distance follows with
 .
.
(2.26)
.2.2.7 Distances of pulsating stars
Several types of pulsating stars show periodic
changes in their brightnesses, where the period of a star is
related to its mass, and thus to its luminosity. This period-luminosity (PL) relation is
ideally suited for distance measurements: since the determination
of the period is independent of distance, one can obtain the
luminosity directly from the period if the calibrated PL-relation
is known. The distance is thus directly derived from the measured
magnitude using (2.25), if the extinction can be determined from
color measurements.
The existence of a relation between the
luminosity and the pulsation period can be expected from simple
physical considerations. Pulsations are essentially radial density
waves inside a star that propagate with the speed of sound,
c s. Thus, one
can expect that the period is comparable to the sound crossing time
through the star, P ∼ R∕c s. The speed of sound
c s in a gas is
of the same order of magnitude as the thermal velocity of the gas
particles, so that  ,
where m p is the
proton mass (and thus a characteristic mass of particles in the
stellar plasma) and k
B is Boltzmann’s constant. According to the virial
theorem, one expects that the gravitational binding energy of the
star is about twice the kinetic (i.e., thermal) energy, so that for
a proton
,
where m p is the
proton mass (and thus a characteristic mass of particles in the
stellar plasma) and k
B is Boltzmann’s constant. According to the virial
theorem, one expects that the gravitational binding energy of the
star is about twice the kinetic (i.e., thermal) energy, so that for
a proton

,
where m p is the
proton mass (and thus a characteristic mass of particles in the
stellar plasma) and k
B is Boltzmann’s constant. According to the virial
theorem, one expects that the gravitational binding energy of the
star is about twice the kinetic (i.e., thermal) energy, so that for
a proton
Combining these relations, we obtain for the
pulsation period

(2.27)
where  is the mean density of the star. This
is a remarkable result—the pulsation period depends only on the
mean density. Furthermore, the stellar luminosity is related to its
mass by approximately L ∝ M 3. If we now consider
stars of equal effective temperature T eff (where
is the mean density of the star. This
is a remarkable result—the pulsation period depends only on the
mean density. Furthermore, the stellar luminosity is related to its
mass by approximately L ∝ M 3. If we now consider
stars of equal effective temperature T eff (where  ), we find that

is the mean density of the star. This
is a remarkable result—the pulsation period depends only on the
mean density. Furthermore, the stellar luminosity is related to its
mass by approximately L ∝ M 3. If we now consider
stars of equal effective temperature T eff (where ), we find that
(2.28)
which is the relation between period and
luminosity that we were aiming for.

Fig. 2.10
Period-luminosity relation for Galactic
Cepheids, measured in three different filters bands (B, V, and I,
from top to bottom). The
absolute magnitudes were corrected for extinction by using colors.
The period is given in days. Open and solid circles denote data for those
Cepheids for which distances were estimated using different
methods; the three objects marked by triangles have a variable period and
are discarded in the derivation of the period-luminosity relation.
The latter is indicated by the solid line, with its parametrization
specified in the plots. The broken
lines indicate the uncertainty range of the
period-luminosity relation. The slope of the period-luminosity
relation increases, and the dispersion of the individual
measurements around the mean PL-relation decreases, if one moves to
redder filters. Source: G.A. Tammann et al. 2003, New Period-Luminosity and Period-Color
relations of classical Cepheids: I. Cepheids in the Galaxy,
A&A 404, 423, p. 436, Fig. 11. ©ESO. Reproduced with
permission
One finds that a well-defined period-luminosity
relation exists for three types of pulsating stars:
-
δ Cepheid stars (classical Cepheids). These are young stars found in the disk population (close to the Galactic plane) and in young star clusters. Owing to their position in or near the disk, extinction always plays a role in the determination of their luminosity. To minimize the effect of extinction it is particularly useful to look at the period-luminosity relation in the near-IR (e.g., in the K-band at λ ∼ 2. 4 μm). Furthermore, the scatter around the period-luminosity relation is smaller for longer wavelengths of the applied filter, as is also shown in Fig. 2.10. The period-luminosity relation is also steeper for longer wavelengths, resulting in a more accurate determination of the absolute magnitude.
-
W Virginis stars, also called population II Cepheids (we will explain the term of stellar populations in Sect. 2.3.2). These are low-mass, metal-poor stars located in the halo of the Galaxy, in globular clusters, and near the Galactic center.
-
RR Lyrae stars. These are likewise population II stars and thus metal-poor. They are found in the halo, in globular clusters, and in the Galactic bulge. Their absolute magnitudes are confined to a narrow interval, M V ∈ [0. 5, 1. 0], with a mean value of about 0.6. This obviously makes them very good distance indicators. More precise predictions of their magnitudes are possible with the following dependence on metallicity and period :
![$$\displaystyle\begin{array}{rcl} &&\left \langle M_{K}\right \rangle = -(2.0 \pm 0.3)\log (P/1\mathrm{d})\,+\,(0.06\,\pm \,0.04)[\mathrm{Fe/H}] \\ &&\quad\qquad\quad- 0.7 \pm 0.1\;. {}\end{array}$$](A129044_2_En_2_Chapter_Equ29.gif) (2.29)
(2.29)
Metallicity. In the last equation, the
metallicity of a star was introduced, which needs to be defined. In
astrophysics, all chemical elements heavier than helium are called
metals. These elements,
with the exception of some traces of lithium, were not produced in
the early Universe but rather later in the interior of stars. The
metallicity is thus also a measure of the chemical evolution and
enrichment of matter in a star or gas cloud. For an element X, the
metallicity index of a star
is defined as
![$$\displaystyle\begin{array}{rcl} \fbox{$[\mathrm{X}/\mathrm{H}] \equiv \log \left (\frac{n(\mathrm{X})} {n(\mathrm{H})}\right )_{{\ast}}-\log \left (\frac{n(\mathrm{X})} {n(\mathrm{H})}\right )_{\odot }$}\;,& &{}\end{array}$$](A129044_2_En_2_Chapter_Equ30.gif)
(2.30)
thus it is the logarithm of the ratio of the
fraction of X relative to hydrogen in the star and in the Sun,
where n is the number
density of the species considered. For example, ![$$[\mathrm{Fe}/\mathrm{H}] = -1$$](A129044_2_En_2_Chapter_IEq33.gif) means that iron has
only a tenth of its Solar abundance. The metallicity Z is the total mass
fraction of all elements heavier than helium; the Sun has
Z ≈ 0. 02, meaning that
about 98 % of the Solar mass is composed of hydrogen and
helium.
means that iron has
only a tenth of its Solar abundance. The metallicity Z is the total mass
fraction of all elements heavier than helium; the Sun has
Z ≈ 0. 02, meaning that
about 98 % of the Solar mass is composed of hydrogen and
helium.
means that iron has
only a tenth of its Solar abundance. The metallicity Z is the total mass
fraction of all elements heavier than helium; the Sun has
Z ≈ 0. 02, meaning that
about 98 % of the Solar mass is composed of hydrogen and
helium.The period-luminosity relations are not only of
significant importance for distance determinations within our
Galaxy. They also play an essential role in extragalactic
astronomy, since the Cepheids (which are by far the most luminous
of the three types of pulsating stars listed above) are also found
and observed outside the Milky Way; they therefore enable us to
directly determine the distances of other galaxies, which is
essential for measuring the Hubble constant. These aspects will be
discussed in detail in Sect. 3.9.
2.3 The structure of the Galaxy
Roughly speaking, the Galaxy consists of the
disk, the central bulge, and the Galactic halo—a roughly spherical
distribution of stars and globular clusters that surrounds the
disk. The disk, whose stars form the visible band of the Milky Way,
contains spiral arms similar to those observed in other spiral
galaxies. The Sun, together with its planets, orbits around the
Galactic center on an approximately circular orbit. The distance
R 0 to the
Galactic center is not very accurately known, as we will discuss
later. To have a reference value, the International Astronomical
Union (IAU) officially defined the value of R 0 in 1985,

(2.31)
More recent examinations have, however, found
that the real value is slightly smaller, R 0 ≈ 8. 0 kpc. The diameter
of the disk of stars, gas, and dust is ∼ 50 kpc. A schematic
depiction of our Galaxy is shown in Fig. 1.6.
2.3.1 The Galactic disk: Distribution of stars
By measuring the distances of stars in the Solar
neighborhood one can determine the three-dimensional stellar
distribution. From these investigations, one finds that there are
different stellar components, as we will discuss below. For each of
them, the number density in the direction perpendicular to the
Galactic disk is approximately described by an exponential law,
 where the scale-height
h specifies the thickness
of the respective component. One finds that h varies between different populations
of stars, motivating the definition of different components of the
Galactic disk. In principle, three components need to be
distinguished: (1) The young thin
disk contains the largest fraction of gas and dust in the
Galaxy, and in this region star formation is still taking place
today. The youngest stars are found in the young thin disk, which
has a scale-height of about h ytd ∼ 100 pc. (2) The
old thin disk is thicker
and has a scale-height of about h otd ∼ 325 pc. (3) The
thick disk has a
scale-height of h
thick ∼ 1. 5 kpc. The thick disk contributes only about
2 % to the total mass density in the Galactic plane at z = 0. This separation into three disk
components is rather coarse and can be further refined if one uses
a finer classification of stellar populations.
where the scale-height
h specifies the thickness
of the respective component. One finds that h varies between different populations
of stars, motivating the definition of different components of the
Galactic disk. In principle, three components need to be
distinguished: (1) The young thin
disk contains the largest fraction of gas and dust in the
Galaxy, and in this region star formation is still taking place
today. The youngest stars are found in the young thin disk, which
has a scale-height of about h ytd ∼ 100 pc. (2) The
old thin disk is thicker
and has a scale-height of about h otd ∼ 325 pc. (3) The
thick disk has a
scale-height of h
thick ∼ 1. 5 kpc. The thick disk contributes only about
2 % to the total mass density in the Galactic plane at z = 0. This separation into three disk
components is rather coarse and can be further refined if one uses
a finer classification of stellar populations.
(2.32)
Molecular gas, out of which new stars are born,
has the smallest scale-height, h mol ∼ 65 pc, followed by
the atomic gas. This can be clearly seen by comparing the
distributions of atomic and molecular hydrogen in Fig. 1.8. The younger a stellar
population is, the smaller its scale-height. Another
characterization of the different stellar populations can be made
with respect to the velocity dispersion of the stars, i.e., the
amplitude of the components of their random motions. As a first
approximation, the stars in the disk move around the Galactic
center on circular orbits. However, these orbits are not perfectly
circular: besides the orbital velocity (which is about 220 km∕s in
the Solar vicinity), they have additional random velocity
components.
Velocity
dispersion. The formal definition of the components of the
velocity dispersion is as follows: let  be the number
density of stars (of a given population) at a fixed location, with
velocities in a volume element d3 v around
be the number
density of stars (of a given population) at a fixed location, with
velocities in a volume element d3 v around  in the vector space of velocities.
If we use Cartesian coordinates, for example
in the vector space of velocities.
If we use Cartesian coordinates, for example  , then
 is the number
of stars with the i-th
velocity component in the interval
is the number
of stars with the i-th
velocity component in the interval ![$$[v_{i},v_{i} + \mathrm{d}v_{i}]$$](A129044_2_En_2_Chapter_IEq38.gif) , and
, and  .
The mean velocity
.
The mean velocity  of the
population then follows from this distribution via
of the
population then follows from this distribution via
 denotes the total number density of stars in the population. The
velocity dispersion σ then
describes the root mean square deviations of the velocities from
denotes the total number density of stars in the population. The
velocity dispersion σ then
describes the root mean square deviations of the velocities from
 . For a
component i of the velocity
vector, the dispersion σ
i is defined
as
. For a
component i of the velocity
vector, the dispersion σ
i is defined
as
be the number
density of stars (of a given population) at a fixed location, with
velocities in a volume element d3 v around in the vector space of velocities.
If we use Cartesian coordinates, for example , then
is the number
of stars with the i-th
velocity component in the interval , and .
The mean velocity of the
population then follows from this distribution via
(2.33)
. For a
component i of the velocity
vector, the dispersion σ
i is defined
as
(2.34)
The larger σ i is, the broader the
distribution of the stochastic motions. We note that the same
concept applies to the velocity distribution of molecules in a gas.
The mean velocity  at each
point defines the bulk velocity of the gas, e.g., the wind speed in
the atmosphere, whereas the velocity dispersion is caused by
thermal motion of the molecules and is determined by the
temperature of the gas.
at each
point defines the bulk velocity of the gas, e.g., the wind speed in
the atmosphere, whereas the velocity dispersion is caused by
thermal motion of the molecules and is determined by the
temperature of the gas.
at each
point defines the bulk velocity of the gas, e.g., the wind speed in
the atmosphere, whereas the velocity dispersion is caused by
thermal motion of the molecules and is determined by the
temperature of the gas.The random motion of the stars in the direction
perpendicular to the disk is the reason for the finite thickness of
the population; it is similar to a thermal distribution.
Accordingly, it has the effect of a pressure, the so-called
dynamical pressure of the
distribution. This pressure determines the scale-height of the
distribution, which corresponds to the law of atmospheres. The
larger the dynamical pressure, i.e., the larger the velocity
dispersion σ
z perpendicular
to the disk, the larger the scale-height h will be. The analysis of stars in the
Solar neighborhood yields σ
z ∼ 16 km∕s for
stars younger than ∼ 3 Gyr, corresponding to a scale-height of
h ∼ 250 pc, whereas stars
older than ∼ 6 Gyr have a scale-height of ∼ 350 pc and a velocity
dispersion of σ
z
∼ 25 km∕s.
The density distribution of the total star
population, obtained from counts and distance determinations of
stars, is to a good approximation described by
 here, R and z are the cylinder coordinates
introduced above (see Sect. 2.1), with the origin at the Galactic center,
and h
thin ≈ h
otd ≈ 325 pc is the scale-height of the thin disk. The
distribution in the radial direction can also be well described by
an exponential law, where h
R ≈ 3. 5 kpc
denotes the scale-length of the
Galactic disk. The normalization of the distribution is
determined by the density n ≈ 0. 2 stars∕pc3 in the
Solar neighborhood, for stars in the range of absolute magnitudes
of 4. 5 ≤ M
V ≤ 9. 5. The
distribution described by (2.35) is not smooth at z = 0; it has a kink at this point and
it is therefore unphysical. To get a smooth distribution which
follows the exponential law for large z and is smooth in the plane of the
disk, the distribution is slightly modified. As an example, for the
luminosity density of the old thin disk (that is proportional to
the number density of the stars), we can write:
here, R and z are the cylinder coordinates
introduced above (see Sect. 2.1), with the origin at the Galactic center,
and h
thin ≈ h
otd ≈ 325 pc is the scale-height of the thin disk. The
distribution in the radial direction can also be well described by
an exponential law, where h
R ≈ 3. 5 kpc
denotes the scale-length of the
Galactic disk. The normalization of the distribution is
determined by the density n ≈ 0. 2 stars∕pc3 in the
Solar neighborhood, for stars in the range of absolute magnitudes
of 4. 5 ≤ M
V ≤ 9. 5. The
distribution described by (2.35) is not smooth at z = 0; it has a kink at this point and
it is therefore unphysical. To get a smooth distribution which
follows the exponential law for large z and is smooth in the plane of the
disk, the distribution is slightly modified. As an example, for the
luminosity density of the old thin disk (that is proportional to
the number density of the stars), we can write:
 with
with  and L 0 ≈ 0. 05L ⊙∕pc3. The Sun
is a member of the young thin disk and is located above the plane
of the disk, at z ≈ 30 pc.
and L 0 ≈ 0. 05L ⊙∕pc3. The Sun
is a member of the young thin disk and is located above the plane
of the disk, at z ≈ 30 pc.
(2.35)
(2.36)
and L 0 ≈ 0. 05L ⊙∕pc3. The Sun
is a member of the young thin disk and is located above the plane
of the disk, at z ≈ 30 pc.2.3.2 The Galactic disk: chemical composition and age; supernovae
Stellar
populations. The chemical composition of stars in the thin
and the thick disks differs: we observe the clear tendency that
stars in the thin disk have a higher metallicity than those in the
thick disk. In contrast, the metallicity of stars in the Galactic
halo and in the bulge is smaller. To paraphrase these trends, one
distinguishes between stars of population I (pop I) which have a
Solar-like metallicity (Z ∼ 0. 02) and are mainly located in
the thin disk, and stars of population II (pop II) that are
metal-poor (Z ∼ 0. 001) and
predominantly found in the thick disk, in the halo, and in the
bulge. In reality, stars cover a wide range in Z, and the figures above are only
characteristic values. For stellar populations a somewhat finer
separation was also introduced, such as ‘extreme population I’,
‘intermediate population II’, and so on. The populations also
differ in age (stars of pop I are younger than those of pop II), in
scale height (as mentioned above), and in the velocity dispersion
perpendicular to the disk (σ z is larger for pop II stars than
for pop I stars).
We shall now attempt to understand the origin of
these different metallicities and their relation to the scale
height and to age, starting with a brief discussion of the
phenomenon that is the main reason for the metal enrichment of the
interstellar medium.
Metallicity and
supernovae. Supernovae (SNe) are explosive events. Within a
few days, a SN can reach a luminosity of  , which is a considerable fraction
of the total luminosity of a galaxy; after that the luminosity
decreases again with a time-scale of weeks. In the explosion, a
star is disrupted and (most of) the matter of the star is driven
into the interstellar medium, enriching it with metals that were
produced in the course of stellar evolution or in the process of
the supernova explosion.
, which is a considerable fraction
of the total luminosity of a galaxy; after that the luminosity
decreases again with a time-scale of weeks. In the explosion, a
star is disrupted and (most of) the matter of the star is driven
into the interstellar medium, enriching it with metals that were
produced in the course of stellar evolution or in the process of
the supernova explosion.Classification of
supernovae. Based on their spectral properties, SNe are
divided into several classes. SNe of Type I do not show any Balmer
lines of hydrogen in their spectrum, in contrast to those of Type
II. The Type I SNe are further subdivided: SNe Ia show strong
emission of Siii
λ 6150 Å whereas no
Siii at all is visible
in spectra of Type Ib,c. Our current understanding of the supernova
phenomenon differs from this spectral classification.6 Following various observational
results and also theoretical analyses, we are confident today that
SNe Ia are a phenomenon which is intrinsically different from the
other supernova types. For this interpretation, it is of particular
importance that SNe Ia are found in all types of galaxies, whereas
we observe SNe II and SNe Ib,c only in spiral and irregular
galaxies, and here only in those regions in which blue stars
predominate. As we will see in Chap. 3, the stellar population in
elliptical galaxies consists almost exclusively of old stars, while
spirals also contain young stars. From this observational fact it
is concluded that the phenomenon of SNe II and SNe Ib,c is linked
to a young stellar population, whereas SNe Ia occur also in older
stellar populations. We shall discuss the two classes of supernovae
next.
Core-collapse
supernovae. SNe II and SNe Ib,c are the final stages in the
evolution of massive ( ≳ 8M
⊙) stars. Inside these stars, ever heavier elements are
generated by nuclear fusion: once all the hydrogen in the inner
region is used up, helium will be burned, then carbon, oxygen, etc.
This chain comes to an end when the iron nucleus is reached, the
atomic nucleus with the highest binding energy per nucleon. After
this no more energy can be gained from fusion to heavier elements
so that the pressure, which is normally balancing the gravitational
force in the star, can no longer be maintained. The star then
collapse under its own gravity. This gravitational collapse
proceeds until the innermost region reaches a density about three
times the density of an atomic nucleus. At this point the so-called
rebounce occurs: a shock wave runs towards the surface, thereby
heating the infalling material, and the star explodes. In the
center, a compact object probably remains—a neutron star or,
possibly, depending on the mass of the iron core, a black hole.
Such neutron stars are visible as pulsars7 at the location of some historically
observed SNe, the most famous of which is the Crab pulsar which has
been identified with a supernovae explosion seen by Chinese
astronomers in 1054. Presumably all neutron stars have been formed
in such core-collapse supernovae.

Fig. 2.11
Chemical shell structure of a massive star
at the end of its life with the axis labeled by the mass within a
given radius. The elements that have been formed in the various
stages of the nuclear burning are ordered in a structure resembling
that of an onion, with heavier elements being located closer to the
center. This is the initial condition for a supernova explosion.
Adapted from A. Unsöld & B. Baschek, The New Cosmos, Springer-Verlag
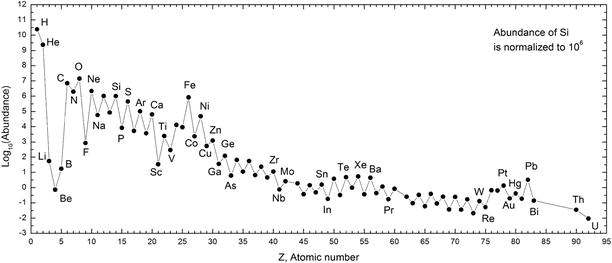
Fig. 2.12
The relative abundance of chemical elements
in the Solar System, normalized such that silicon attains the value
106. By far the most abundant elements are hydrogen and
helium; as we will see later, these elements were produced in the
first 3 min of the cosmic evolution. Essentially all the other
elements were produced later in stellar interiors. As a general
trend, the abundances decrease with increasing atomic number,
except for the light elements lithium (Li), beryllium (Be), and
boron (B), which are generated in stars, but also easily destroyed
due to their low binding energy. Superposed on this decrease, the
abundances show an oscillating behavior: nuclei with an even number
of protons are more abundant than those with an odd atomic
number—this phenomenon is due to the production of alpha elements
in core-collapse supernovae. Furthermore, iron (Fe), cobalt (Co)
and nickel (Ni) stick out in their relatively high abundance, given
their atomic number, which is due to their abundant production
mainly in Type Ia SNe. Source: Wikipedia, numerical data from:
Katharina Lodders
The major fraction of the binding energy released
in the formation of the compact object is emitted in the form of
neutrinos: about 3 × 1053 erg. Underground neutrino
detectors were able to trace about 10 neutrinos originating from SN
1987A in the Large Magellanic Cloud.8 Due to the high density inside the
star after the collapse, even neutrinos, despite their very small
cross section, are absorbed and scattered, so that part of their
outward-directed momentum contributes to the explosion of the
stellar envelope. This shell expands at v ∼ 10 000 km∕s, corresponding to a
kinetic energy of E
kin ∼ 1051 erg. Of this, only about
1049 erg is converted into photons in the hot envelope
and then emitted—the energy of a SN that is visible in photons is
thus only a small fraction of the total energy produced.
Owing to the various stages of nuclear fusion in
the progenitor star, the chemical elements are arranged in shells:
the light elements (H, He) in the outer shells, and the heavier
elements (C, O, Ne, Mg, Si, Ar, Ca, Fe, Ni) in the inner ones—see
Fig. 2.11.
The explosion ejects them into the interstellar medium which is
thus chemically enriched. It is important to note that mainly
nuclei with an even number of protons and neutrons are formed. This
is a consequence of the nuclear reaction chains involved, where
successive nuclei in this chain are obtained by adding an
α-particle
(or4He-nucleus), i.e., two protons and two neutrons.
Such elements are therefore called α-elements. The dominance of
α-elements in the chemical
abundance of the interstellar medium, as well as in the Solar
System (see Fig. 2.12), is thus a clear indication of nuclear
fusion occurring in the He-rich zones of stars where the hydrogen
has been burnt.
Supernovae Type
Ia.
SNe Ia are most likely the explosions of white
dwarfs (WDs). These compact stars which form the final
evolutionary stages of less massive stars no longer maintain their
internal pressure by nuclear fusion. Rather, they are stabilized by
the degeneracy pressure of the electrons—a quantum mechanical
phenomenon related to the Fermi exclusion principle. Such a white
dwarf can be stable only if its mass does not exceed a limiting
mass, the Chandrasekhar
mass; it has a value of  . For
M > M Ch, the degeneracy
pressure can no longer balance the gravitational force.
. For
M > M Ch, the degeneracy
pressure can no longer balance the gravitational force.
. For
M > M Ch, the degeneracy
pressure can no longer balance the gravitational force.A white dwarf can become unstable if its mass
approaches the Chandrasekhar mass limit. There are two different
scenarios with which this is possible: If the white dwarf is part
of a close binary system, matter from the companion star may flow
onto the white dwarf; this is called the ‘single-degenerate’ model.
In this process, its mass will slowly increase and approach the
limiting mass. At about M ≈ 1. 3M ⊙, carbon burning will
ignite in its interior, transforming about half of the star into
iron-group elements, i.e., iron, cobalt, and nickel. The resulting
explosion of the star will enrich the ISM
with ∼ 0. 6 M
⊙ of Fe, while the WD itself will be torn apart
completely, leaving no remnant star. A second (so-called
‘double-degenerate’) scenario for the origin of SNe Ia is that of
the merger of two white dwarfs for which the sum of their masses
exceeds the Chandrasekhar mass. Of course, these two scenarios are
not mutually exclusive, and both routes may be realized in
nature.
Since the initial conditions are probably very
homogeneous for the class of SNe Ia in the single-degenerate
scenario (defined by the limiting mass prior to the trigger of the
explosion), they are good candidates for standard candles: all SNe Ia have
approximately the same luminosity. As we will discuss later (see
Sect. 3.9.4), this is not really the
case, but nevertheless SNe Ia play a very important role in the
cosmological distance determination, and thus in the determination
of cosmological parameters. On the other hand, in the
double-degenerate scenario, the class of SNe Ia is not expected to
be very homogeneous, as the mass prior to the explosion no longer
attains a universal value. In fact, there are some SNe Ia which are
clearly different from the majority of this class, by being far
more luminous. It may be that such events are triggered by the
merging of two white dwarfs, whereas the majority of the explosions
is caused by the single-degenerate formation process.
This interpretation of the different types of SNe
explains why one finds core-collapse SNe only in galaxies in which
star formation occurs. They are the final stages of massive, i.e.,
young, stars which have a lifetime of not more than 2 ×
107 yr. By contrast, SNe Ia can occur in all types of
galaxies, since their progenitors are members of an old stellar
population.
In addition to SNe, metal enrichment of the
interstellar medium (ISM) also takes place in other stages of
stellar evolution, by stellar winds or during phases in which stars
eject part of their envelope which is then visible, e.g., as a
planetary nebula. If the matter in the star has been mixed by
convection prior to such a phase, so that the metals newly formed
by nuclear fusion in the interior have been transported towards the
surface of the star, these metals will then be released into the
ISM.
Age-metallicity
relation. Assuming that at the beginning of its evolution
the Milky Way had a chemical composition with only low metal
content, the metallicity should be strongly related to the age of a
stellar population. With each new generation of stars, more metals
are produced and ejected into the ISM, partially by stellar winds,
but mainly by SN explosions. Stars that are formed later should
therefore have a higher metal content than those that were formed
in the early phase of the Galaxy. One would thus expect that a
relation exists between the age of a star and its
metallicity.
For instance, under this assumption the iron
abundance [Fe/H] can be used as an age indicator for a stellar
population, with the iron predominantly being produced and ejected
in SNe of Type Ia. Therefore, a newly formed generation of stars
has a higher fraction of iron than their predecessors, and the
youngest stars should have the highest iron abundance. Indeed one
finds ![$$[\mathrm{Fe}/\mathrm{H}] = -4.5$$](A129044_2_En_2_Chapter_IEq46.gif) (i.e., 3 ×
10−5 of the Solar iron abundance) for extremely old
stars, whereas very young stars have
(i.e., 3 ×
10−5 of the Solar iron abundance) for extremely old
stars, whereas very young stars have ![$$[\mathrm{Fe}/\mathrm{H}] = 1$$](A129044_2_En_2_Chapter_IEq47.gif) , so their metallicity
can significantly exceed that of the Sun.
, so their metallicity
can significantly exceed that of the Sun.
(i.e., 3 ×
10−5 of the Solar iron abundance) for extremely old
stars, whereas very young stars have , so their metallicity
can significantly exceed that of the Sun.However, this age-metallicity relation is not
very tight. On the one hand, SNe Ia occur only ≳ 109 yr
after the formation of a stellar population. The exact time-span is
not known because even if one accepts the accretion scenario for SN
Ia described above, it is unclear in what form and in what systems
the accretion of material onto the white dwarf takes place and how
long it typically takes until the limiting mass is reached. On the
other hand, the mixing of the SN ejecta in the ISM occurs only
locally, so that large inhomogeneities of the [Fe/H] ratio may be
present in the ISM, and thus even for stars of the same age. An
alternative measure for metallicity is [O/H], because oxygen, which
is an α-element, is
produced and ejected mainly in supernova explosions of massive
stars. These happen just ∼ 107yr after the formation of
a stellar population, which is virtually instantaneous.
Origin of the
thick disk. Characteristic values for the metallicity are
![$$-0.5 \lesssim [\mathrm{Fe/H}] \lesssim 0.3$$](A129044_2_En_2_Chapter_IEq48.gif) in the
thin disk, while for the thick disk
in the
thin disk, while for the thick disk ![$$-1.0 \lesssim [\mathrm{Fe/H}] \lesssim -0.4$$](A129044_2_En_2_Chapter_IEq49.gif) is
typical. From this, one can deduce that stars in the thin disk must
be significantly younger on average than those in the thick disk.
This result can now be interpreted using the age-metallicity
relation. Either star formation has started earlier, or ceased
earlier, in the thick disk than in the thin disk, or stars that
originally belonged to the thin disk have migrated into the thick
disk. The second alternative is favored for various reasons. It
would be hard to understand why molecular gas, out of which stars
are formed, was much more broadly distributed in earlier times than
it is today, where we find it well concentrated near the Galactic
plane. In addition, the widening of an initially narrow stellar
distribution in time is also expected. The matter distribution in
the disk is not homogeneous and, along their orbits around the
Galactic center, stars experience this inhomogeneous gravitational
field caused by other stars, spiral arms, and massive molecular
clouds. Stellar orbits are perturbed by such fluctuations, i.e.,
they gain a random velocity component perpendicular to the disk
from local inhomogeneities of the gravitational field. In other
words, the velocity dispersion σ z of a stellar population grows
in time, and the scale height of a population increases. In
contrast to stars, the gas keeps its narrow distribution around the
Galactic plane due to internal friction.
is
typical. From this, one can deduce that stars in the thin disk must
be significantly younger on average than those in the thick disk.
This result can now be interpreted using the age-metallicity
relation. Either star formation has started earlier, or ceased
earlier, in the thick disk than in the thin disk, or stars that
originally belonged to the thin disk have migrated into the thick
disk. The second alternative is favored for various reasons. It
would be hard to understand why molecular gas, out of which stars
are formed, was much more broadly distributed in earlier times than
it is today, where we find it well concentrated near the Galactic
plane. In addition, the widening of an initially narrow stellar
distribution in time is also expected. The matter distribution in
the disk is not homogeneous and, along their orbits around the
Galactic center, stars experience this inhomogeneous gravitational
field caused by other stars, spiral arms, and massive molecular
clouds. Stellar orbits are perturbed by such fluctuations, i.e.,
they gain a random velocity component perpendicular to the disk
from local inhomogeneities of the gravitational field. In other
words, the velocity dispersion σ z of a stellar population grows
in time, and the scale height of a population increases. In
contrast to stars, the gas keeps its narrow distribution around the
Galactic plane due to internal friction.
in the
thin disk, while for the thick disk is
typical. From this, one can deduce that stars in the thin disk must
be significantly younger on average than those in the thick disk.
This result can now be interpreted using the age-metallicity
relation. Either star formation has started earlier, or ceased
earlier, in the thick disk than in the thin disk, or stars that
originally belonged to the thin disk have migrated into the thick
disk. The second alternative is favored for various reasons. It
would be hard to understand why molecular gas, out of which stars
are formed, was much more broadly distributed in earlier times than
it is today, where we find it well concentrated near the Galactic
plane. In addition, the widening of an initially narrow stellar
distribution in time is also expected. The matter distribution in
the disk is not homogeneous and, along their orbits around the
Galactic center, stars experience this inhomogeneous gravitational
field caused by other stars, spiral arms, and massive molecular
clouds. Stellar orbits are perturbed by such fluctuations, i.e.,
they gain a random velocity component perpendicular to the disk
from local inhomogeneities of the gravitational field. In other
words, the velocity dispersion σ z of a stellar population grows
in time, and the scale height of a population increases. In
contrast to stars, the gas keeps its narrow distribution around the
Galactic plane due to internal friction.This interpretation is, however, not unambiguous.
Another scenario for the formation of the thick disk is also
possible, where the stars of the thick disk were formed outside the
Milky Way and only became constituents of the disk later, through
accretion of satellite galaxies. This model is supported, among
other reasons, by the fact that the rotational velocity of the
thick disk around the Galactic center is smaller by ∼ 50 km∕s than
that of the thin disk. In other spirals, in which a thick disk
component was found and kinematically analyzed, the discrepancy
between the rotation curves of the thick and thin disks is
sometimes even stronger. In one case, the thick disk was observed
to rotate around the center of the galaxy in the opposite direction
to the gas disk. In such a case, the aforementioned model of the
evolution of the thick disk by kinematic heating of stars would
definitely not apply.
Mass-to-light
ratio. The total stellar mass of the thin disk is ∼ 6 ×
1010 M
⊙, to which ∼ 0. 5 × 10¹⁰ M ⊙ in the form of dust and
gas has to be added. The luminosity of the stars in the thin disk
is  .
Together, this yields a mass-to-light ratio of
.
Together, this yields a mass-to-light ratio of

.
Together, this yields a mass-to-light ratio of
(2.37)
The M∕L ratio in the thick disk is higher, as
expected from an older stellar population. The relative
contribution of the thick disk to the stellar budget of the Milky
Way is quite uncertain; estimates range from ∼ 5
to ∼ 30 %, which reflects
the difficulty to attribute individual stars to the thin vs. thick
disk; also the criteria for this classification vary substantially.
In any case, due to the larger mass-to-light ratio of the thick
disk, its contribution to the luminosity of the Milky Way is small.
Nevertheless, the thick disk is invaluable for the diagnosis of the
dynamical evolution of the disk. If the Milky Way were to be
observed from the outside, one would find a M∕L value for the disk of about four in
Solar units; this is a characteristic value for spiral
galaxies.
2.3.3 The Galactic disk: dust and gas
Spatial
distribution. The spiral structure of the Milky Way and
other spiral galaxies is delineated by very young objects like O-
and B-stars and Hii-regions.9 This is the reason why spiral arms
appear blue. Obviously, star formation in our Milky Way takes place
mainly in the spiral arms. Here, the molecular clouds —gas clouds which are
sufficiently dense and cool for molecules to form in large
abundance—contract under their own gravity and form new stars. The
spiral arms are much less prominent in red light (see also
Fig. 3.24 below). Emission in the red is
dominated by an older stellar population, and these old stars have
had time to move away from the spiral arms. The Sun is located
close to, but not in, a spiral arm—the so-called Orion arm (see
Fig. 2.13).
Open
clusters. Star formation in molecular clouds leads to the
formation of open star clusters, since stars are not born
individually; instead, the contraction of a molecular cloud gives
rise to many stars at the same time, which form an (open) star
cluster. Its mass depends of course on the mass of the parent
molecular cloud, ranging from ∼ 100 M ⊙ to  . The stars in these
clusters all have the same velocity—indeed, the velocity dispersion
in open clusters is small, below ∼ 1 km∕s.
. The stars in these
clusters all have the same velocity—indeed, the velocity dispersion
in open clusters is small, below ∼ 1 km∕s.
. The stars in these
clusters all have the same velocity—indeed, the velocity dispersion
in open clusters is small, below ∼ 1 km∕s.Since molecular gas is concentrated close to the
Galactic plane, such star clusters in the Milky Way are born there.
Most of the open clusters known have ages below 300 Myr, and those
are found within ∼ 50 pc of the Galactic plane. Older clusters can
have larger | z | , as they
can move from their place of birth, similar to what we said about
the stars in the thick disk. The reason why we see only a few open
clusters with ages above 1 Gyr is that these are not strongly
gravitationally bound, if at all. Hence, in the course of time,
tidal gravitational forces dissolve such clusters, and this effect
is more important at small galactocentric radii R.
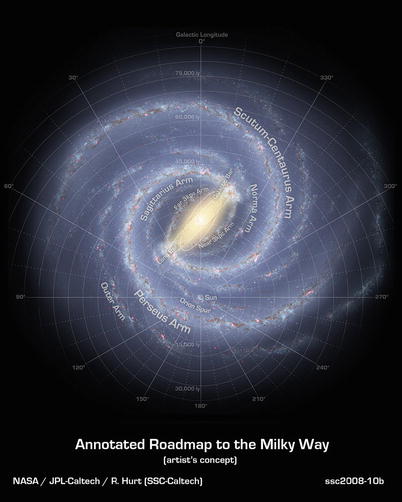
Fig. 2.13
A sketch of the plane of the Milky Way,
based to a large degree on observations from the Spitzer Space
Telescope. It shows the two major spiral arms which originate at
the ends of the central bar, as well as two minor spiral arms. The
Sun is located near the Orion arm, a partial spiral arm. Credit:
NASA/JPL-Caltech/R. Hurt (SSC/Caltech)
Observing the gas
in the Galaxy is made possible mainly by the 21 cm line
emission of Hi (neutral
atomic hydrogen) and by the emission of CO, the second-most
abundant molecule after H2 (molecular hydrogen).
H2 is a symmetric molecule and thus has no electric
dipole moment, which is the main reason why it does not radiate
strongly. In most cases it is assumed that the ratio of CO to
H2 is a universal constant (called the ‘X-factor’ ).
Under this assumption, the distribution of CO can be converted into
that of the total molecular gas. The Milky Way is optically thin at
21 cm, i.e., 21 cm radiation is not absorbed along its path from
the source to the observer. With radio-astronomical methods it is
thus possible to observe atomic gas throughout the entire
Galaxy.

Fig. 2.14
Distribution of dust in the Galaxy, derived
from a combination of IRAS and COBE sky maps. The northern Galactic
sky in Galactic coordinates is displayed on the left, the southern on the right. We can clearly see the
concentration of dust towards the Galactic plane, as well as
regions with a very low column density of dust; these regions in
the sky are particularly well suited for very deep extragalactic
observations. Source: D.J. Schlegel, D.P. Finkbeiner & M. Davis
1998, Maps of Dust Infrared
Emission for Use in Estimation of Reddening and Cosmic Microwave
Background Radiation Foregrounds, ApJ 500, 525, p. 542,
Fig. 8. ©AAS. Reproduced with permission
Distribution of
dust. To examine the distribution of dust, two options are
available. First, dust is detected by the extinction it causes.
This effect can be analyzed quantitatively, for instance by star
counts or by investigating the reddening of stars (an example of
this can be seen in Fig. 2.8). Second, dust emits thermal radiation,
observable in the FIR part of the spectrum, which was mapped by
several satellites such as IRAS and COBE. By combining the sky maps
of these two satellites at different frequencies, the Galactic
distribution of dust was determined. The dust temperature varies in
a relatively narrow range between ∼ 17 and ∼ 21 K, but even across
this small range, the dust emission varies, for fixed column
density, by a factor ∼ 5 at a wavelength of 100 μm. Therefore, one
needs to combine maps at different frequencies in order to
determine column densities and temperatures. In addition, the
zodiacal light caused by the reflection of Solar radiation by dust
inside our Solar system has to be subtracted before the Galactic
FIR emission can be analyzed. This is possible with multi-frequency
data because of the different spectral shapes. The resulting
distribution of dust is displayed in Fig. 2.14. It shows the
concentration of dust around the Galactic plane, as well as
large-scale anisotropies at high Galactic latitudes. The dust map
shown here is routinely used for extinction correction when
observing extragalactic sources.
Besides a strong concentration towards the
Galactic plane, gas and dust are preferentially found in spiral
arms where they serve as raw material for star formation. Molecular
hydrogen (H2) and dust are generally found at
3 kpc ≲ R ≲ 8 kpc, within
 of both sides of the Galactic plane. In contrast, the distribution
of atomic hydrogen (Hi)
is observed out to much larger distances from the Galactic center
(R ≲ 25kpc), with a scale
height of ∼ 160 pc inside the Solar orbit, R ≲ R 0. At larger distances
from the Galactic center, R ≳ 12 kpc, the scale height increases
substantially to ∼ 1 kpc. The gaseous disk is warped at these large
radii though the origin of this warp is unclear. For example, it
may be caused by the gravitational field of the Magellanic Clouds.
The total mass in the two components of hydrogen is about
M(Hi) ≈ 4 × 10⁹ M ⊙ and
of both sides of the Galactic plane. In contrast, the distribution
of atomic hydrogen (Hi)
is observed out to much larger distances from the Galactic center
(R ≲ 25kpc), with a scale
height of ∼ 160 pc inside the Solar orbit, R ≲ R 0. At larger distances
from the Galactic center, R ≳ 12 kpc, the scale height increases
substantially to ∼ 1 kpc. The gaseous disk is warped at these large
radii though the origin of this warp is unclear. For example, it
may be caused by the gravitational field of the Magellanic Clouds.
The total mass in the two components of hydrogen is about
M(Hi) ≈ 4 × 10⁹ M ⊙ and  ,
respectively, i.e., the gas mass in our Galaxy is less
than ∼ 10 % of the stellar
mass. The density of the gas in the Solar neighborhood is about
,
respectively, i.e., the gas mass in our Galaxy is less
than ∼ 10 % of the stellar
mass. The density of the gas in the Solar neighborhood is about
 .
.
of both sides of the Galactic plane. In contrast, the distribution
of atomic hydrogen (Hi)
is observed out to much larger distances from the Galactic center
(R ≲ 25kpc), with a scale
height of ∼ 160 pc inside the Solar orbit, R ≲ R 0. At larger distances
from the Galactic center, R ≳ 12 kpc, the scale height increases
substantially to ∼ 1 kpc. The gaseous disk is warped at these large
radii though the origin of this warp is unclear. For example, it
may be caused by the gravitational field of the Magellanic Clouds.
The total mass in the two components of hydrogen is about
M(Hi) ≈ 4 × 10⁹ M ⊙ and ,
respectively, i.e., the gas mass in our Galaxy is less
than ∼ 10 % of the stellar
mass. The density of the gas in the Solar neighborhood is about
.Phases of the
interstellar medium. Gas in the Milky Way exists at a range
of different temperatures and densities. The coolest phase of the
interstellar medium is that represented by molecular gas. Since
molecules are easily destroyed by photons from hot stars, they need
to be shielded from the interstellar radiation field, which is
provided by the dust embedded in the gas. The molecules can cool
the gas efficiently even at low temperatures: through collisions
between particles, part of the kinetic energy can be used to put
one of the particles into an excited state, and thus to remove
kinetic energy from the particle distribution, thereby lowering
their mean velocity and, thus, their temperature. This is possible
only if the kinetic energy is high enough for this internal
excitation. Molecules have excited levels at low energies—the
rotational and vibrational excitations—so they are able to cool
cold gas; in fact, this is the necessary condition for the
formation of stars. The energy in the excited level is then
released by the emission of a photon which can escape. The range of
temperatures in the molecular gas phase extends from ∼ 10 K to
about 70 K, with characteristic densities of 100 particles per
cm3.
A second prominent phase is the warm interstellar
gas, with temperatures of a few thousand degrees. Depending on
T, the fraction of atoms
which are ionized, i.e., the ionization fraction, can range from
0.01 to 1. This gas can be heated by hydrodynamical processes or by
photoionization. For example, gas near to a hot star will be
ionized by the energetic photons. The kinetic energy of the
electron released in this photoionization process is the difference
between the energy of the ionizing photon and the binding energy of
the electron. The energy of the electron is then transferred to the
gas through collisions, thus providing an effective heating source.
Cooling is provided by atomic transitions excited by collisions
between atoms, or recombination of atoms with electrons, and the
subsequent emission of photons from the excited states. Since
hydrogen is by far the most abundant species, its atomic
transitions dominate the cooling for T ≳ 5000 K, and is then a very
efficient coolant. Because of that, the temperature of this warm
gas tends towards T ∼ 8000 K, almost independent of the intensity
and spectrum of the ionizing radiation, at least over a wide range
of these parameters. Perhaps the best known examples for this gas
are the aforementioned Hii regions around hot stars, and
planetary nebulae.
2.3.4 Cosmic rays
The magnetic field
of the Galaxy. Like many other cosmic objects, the Milky Way
contains a magnetic field. The properties of this field can be
analyzed using a variety of methods, and we list some of them in
the following.
-
Polarization of stellar light. The light of distant stars is partially polarized, with the degree of polarization being strongly related to the extinction, or reddening, of the star. This hints at the polarization being linked to the dust causing the extinction. The light scattered by dust particles is partially linearly polarized, with the direction of polarization depending on the alignment of the dust grains. If their orientation was random, the superposition of the scattered radiation from different dust particles would add up to a vanishing net polarization. However, a net polarization is measured, so the orientation of dust particles cannot be random, rather it must be coherent on large scales. Such a coherent alignment is provided by a large-scale magnetic field, whereby the orientation of dust particles, measurable from the polarization direction, indicates the (projected) direction of the magnetic field.
-
The Zeeman effect. The energy levels in an atom change if the atom is placed in a magnetic field. Of particular importance in the present context is the fact that the 21 cm transition line of neutral hydrogen is split in a magnetic field. Because the amplitude of the line split is proportional to the strength of the magnetic field, the field strength can be determined from observations of this Zeeman effect.
-
Synchrotron radiation. When relativistic electrons move in a magnetic field they are subject to the Lorentz force. The corresponding acceleration is perpendicular both to the velocity vector of the particles and to the magnetic field vector. As a result, the electrons follow a helical (i.e., corkscrew) track, which is a superposition of circular orbits perpendicular to the field lines and a linear motion along the field. Since accelerated charges emit electromagnetic radiation, this helical movement is the source of the so-called synchrotron radiation (which will be discussed in more detail in Sect. 5.1.2). This radiation, which is observable at radio frequencies, is linearly polarized, with the direction of the polarization depending on the direction of the magnetic field.
-
Faraday rotation. If polarized radiation passes through a magnetized plasma, the direction of the polarization rotates. The rotation angle depends quadratically on the wavelength of the radiation,
 (2.38)The rotation measure RM is the integral along the line-of-sight towards the source over the electron density and the component B ∥ of the magnetic field in direction of the line-of-sight,
 (2.39)The dependence of the rotation angle (2.38) on λ allows us to determine the rotation measure RM, and thus to estimate the product of electron density and magnetic field. If the former is known, one immediately gets information about B. By measuring the RM for sources in different directions and at different distances the magnetic field of the Galaxy can be mapped.
From applying the methods discussed above, we
know that a magnetic field exists in the disk of our Milky Way.
This field has a strength of about 4 × 10⁻⁶ G and mainly
follows the spiral arms.
Cosmic
rays. We obtain most of the information about our Universe
from the electromagnetic radiation that we observe. However, we
receive an additional radiation component, the energetic cosmic
rays, which were discovered by Victor Hess in 1912 who carried out
balloon flights and found that the degree of ionizing radiation
increases with increasing height. Cosmic rays consist primarily of
electrically charged particles, mainly electrons and nuclei. In
addition to the particle radiation that is produced in energetic
processes at the Solar surface, a much more energetic cosmic ray
component exists that can only originate in sources outside the
Solar system.

Fig. 2.15
The energy spectrum dN∕dE of cosmic rays, for better visibility
multiplied by E
2. Data from different experiments are shown by
different symbols. At
energies below 1010 eV (not shown), the flux of cosmic
rays is dominated by those from the Sun, whereas for higher
energies, they are due to sources in our Galaxy or beyond. The
energy spectrum is well described by piecewise power-law spectra,
with a steepening at E ∼ 1015 eV (called the
knee), and a flattening at E ∼ 3 × 10¹⁸ eV. Beyond
E ∼ 3 × 10¹⁹ eV,
the spectrum shows a cut-off. Also indicated is the energy of a
cosmic ray proton whose collision with a proton in the Earth’
atmosphere has the same center-of-mass energy as the highest energy
collisions at the Large Hadron Collider at CERN. The cosmic ray
fluxes are very small: cosmic rays with energies larger
than ∼ 1015 eV arrive at the Earth at a rate of about 1
per m2 per year, those with energies above
1018 eV come at a rate of approximately  ; this implies that one
needs huge detectors to study these particles. Source: K. Kotera
& A.V. Olinto 2011, The
Astrophysics of Ultrahigh-Energy Cosmic Rays, ARA&A 49,
119, p. 120, Fig. 1. Reprinted, with permission, from the
Annual Review of Astronomy &
Astrophysics, Volume 49 ©2011 by Annual Reviews www.annualreviews.org
; this implies that one
needs huge detectors to study these particles. Source: K. Kotera
& A.V. Olinto 2011, The
Astrophysics of Ultrahigh-Energy Cosmic Rays, ARA&A 49,
119, p. 120, Fig. 1. Reprinted, with permission, from the
Annual Review of Astronomy &
Astrophysics, Volume 49 ©2011 by Annual Reviews www.annualreviews.orgThe energy spectrum of the cosmic rays is, to a
good approximation, a power law: the flux of particles with energy
between E and E + dE can be written as  ,
with q ≈ 2. 7. However, as
can be seen in Fig. 2.15, the slope of the spectrum changes
slightly, but significantly, at some energy scales: at E ∼ 1015 eV the spectrum
becomes steeper, and at E ≳ 1018 eV it flattens
again10; these two
energy scales in the cosmic ray spectrum have been given the
suggestive names of ‘knee’ and ‘ankle’, respectively. Measurements
of the spectrum at these high energies are rather uncertain,
however, because of the strongly decreasing flux with increasing
energy. This implies that only very few particles are
detected.
,
with q ≈ 2. 7. However, as
can be seen in Fig. 2.15, the slope of the spectrum changes
slightly, but significantly, at some energy scales: at E ∼ 1015 eV the spectrum
becomes steeper, and at E ≳ 1018 eV it flattens
again10; these two
energy scales in the cosmic ray spectrum have been given the
suggestive names of ‘knee’ and ‘ankle’, respectively. Measurements
of the spectrum at these high energies are rather uncertain,
however, because of the strongly decreasing flux with increasing
energy. This implies that only very few particles are
detected.Cosmic ray
acceleration and confinement. To accelerate particles to
such high energies , very energetic processes are necessary. For
energies below 1015 eV, very convincing arguments
suggest supernova remnants as the sites of the acceleration. The SN
explosion drives a shock front11 into the ISM with an initial
velocity of ∼ 10 000 km∕s. Plasma processes in a shock front can
accelerate some particles to very high energies. The theory of this
diffuse shock acceleration predicts that the resulting energy
spectrum of the particles follows a power law, the slope of which
depends only on the strength of the shock (i.e., the ratio of the
densities on both sides of the shock front). This power law agrees
very well with the slope of the observed cosmic ray spectrum below
the knee, if additional effects caused by the propagation of
particles in the Milky Way (e.g., energy losses, and the
possibility for escaping the Galaxy) are taken into account. The
presence of very energetic electrons in SN remnants is observed
directly by their synchrotron emission, so that the slope of the
produced spectrum can be inferred by observations.
Accelerated particles then propagate through the
Galaxy where, due to the magnetic field, they move along
complicated helical tracks. Therefore, the direction from which a
particle arrives at Earth cannot be identified with the direction
to its source of origin. The magnetic field is also the reason why
particles do not leave the Milky Way along a straight path, but
instead are stored for a long time ( ∼ 107 yr) before
they eventually diffuse out, an effect called confinement.
The sources of the particles with energy
between ∼ 1015 eV and ∼ 1018 eV are likewise
presumed to be located inside our Milky Way, because the magnetic
field is sufficiently strong to confine them in the Galaxy. It is
not known, however, whether these particles are also accelerated in
supernova remnants; if they are, the steepening of the spectrum may
be related to the fact that particles with E ≳ 1015 eV have a Larmor
radius which no longer is small compared to the size of the remnant
itself, and so they find it easier to escape from the accelerating
region. Particles with energies larger than ∼ 1018 eV
are probably of extragalactic origin. The radius of their helical
tracks in the magnetic field of the Galaxy, i.e., their Larmor
radius, is larger than the radius of the Milky Way itself, so they
cannot be confined. Their origin is also unknown, but AGNs are the
most probable source of these particles.
Ultra-high energy
cosmic rays. Finally, one of the largest puzzles of
high-energy astrophysics is the origin of cosmic rays with
E ≳ 1019 eV. The
energy of these so-called ultra-high energy cosmic rays (UHECRs) is
so large that they are able to interact with the cosmic microwave
background to produce pions and other particles, losing much of
their energy in this process. These particles cannot propagate much
further than ∼ 100 Mpc through the Universe before they have lost
most of their energy. This implies that their acceleration sites
should be located in the close vicinity of the Milky Way. Since the
curvature of the orbits of such highly energetic particles is very
small, it should, in principle, be possible to identify their
origin: there are not many AGNs within 100 Mpc that are promising
candidates for the origin of these ultra-high energy cosmic rays.
Furthermore, the maximal possible distance a cosmic ray particle
can propagate through the Universe decreases strongly with
increasing energy, so that the number of potential sources must
decrease accordingly. Once this minimal distance is below the
nearest AGN, there should be essentially no particle that can reach
us. In other words, one expects to see a cut-off (called the
Greisen–Zatsepin–Kuzmin, or GZK cut-off) in the energy spectrum at
E ∼ 2 × 10²⁰ eV,
but beginning already at E ≳ 5 × 10¹⁹ eV. Before
2007, this cut-off was not observed, and different cosmic ray
experiments reported a different energy spectrum for these
UHECRs—based, literally, on a handful of events.
The breakthrough came with the first results from
the Auger experiment, the by far most sensitive experiment owing to
its large effective area.12 When the first results were
published in 2007, the expected high-energy cut-off in the UHECR
spectrum was detected—thereby erasing the necessity for many very
exotic processes that had been proposed earlier to account for the
apparent lack of this cut-off. With this detection the idea about
the origin of the UHECRs from sources within a distance
of ∼ 100 Mpc is strongly supported. But if this is indeed the case,
these sources should be identified.
Indeed, a correlation between the arrival
direction of UHECRs and the direction of nearby AGN has been found,
providing evidence that these are the places in which particles can
be accelerated to such high energies. From a statistical analysis
of this correlation, the typical angular separation between the
cosmic ray and the corresponding AGN is estimated to
be ∼ 3∘, which may be identified with the deflection of
direction that a cosmic ray experiences on its way to Earth, most
likely due to magnetic fields. Whereas substantially increased
statistics, possible with accumulating data, is needed to confirm
this correlation, the big puzzle about the UHECRs may have found a
solution.
Energy
density. It is interesting to realize that the energy
densities of cosmic rays, the magnetic field, the turbulent energy
of the ISM, and the electromagnetic radiation of the stars are
about the same—as if an equilibrium between these different
components has been established. Since these components interact
with each other—e.g., the turbulent motions of the ISM can amplify
the magnetic field, and vice versa, the magnetic field affects the
velocity of the ISM and of cosmic rays—it is not improbable that
these interaction processes can establish an equipartition of the
energy densities.
Gamma radiation
from the Milky Way. The Milky Way emits γ-radiation, as can be seen in
Fig. 1.8. There is diffuse γ-ray emission which can be traced back
to the cosmic rays in the Galaxy. When these energetic particles
collide with nuclei in the interstellar medium, radiation is
released. This gives rise to a continuum radiation which closely
follows a power-law spectrum, such that the observed flux
S ν is ∝ ν −α , with α ∼ 2. The quantitative analysis of the
distribution of this emission provides the most important
information about the spatial distribution of cosmic rays in the
Milky Way.
Gamma-ray
lines. In addition to the continuum radiation, one also
observes line radiation in γ-rays, at energies below ∼ 10 MeV. The
first detected and most prominent line has an energy of 1. 809 MeV
and corresponds to a radioactive decay of the Al26
nucleus. The spatial distribution of this emission is strongly
concentrated towards the Galactic disk and thus follows the young
stellar population in the Milky Way. Since the lifetime of the
Al26 nucleus is short ( ∼ 106 yr), it must be
produced near the emission site, which then implies that it is
produced by the young stellar population. It is formed in hot stars
and released to the interstellar medium either through stellar
winds or core-collapse supernovae. Gamma-lines from other
radioactive nuclei have been detected as well.
Annihilation
radiation from the Galaxy. Furthermore, line radiation with
an energy of 511 keV has been detected in the Galaxy. This line is
produced when an electron and a positron annihilate into two
photons, each with an energy corresponding to the rest-mass energy
of an electron, i.e., 511 keV.13 This annihilation radiation was
identified first in the 1970s. With the Integral satellite, its
emission morphology has been mapped with an angular resolution
of ∼ 3∘. The 511 keV line emission is detected both from
the Galactic disk and the bulge. The angular resolution is not
sufficient to tell whether the annihilation line traces the young
stellar population (i.e., the thin disk) or the older population in
the thick disk. However, one can compare the distribution of the
annihilation radiation with that of Al26 and other
radioactive species. In about 85 % of all decays Al26
emits a positron. If this positron annihilates close to its
production site one can predict the expected annihilation radiation
from the distribution of the 1. 809 MeV line. In fact, the
intensity and angular distribution of the 511 keV line from the
disk are compatible with this scenario for the generation of
positrons.
The origin of the annihilation radiation from the
bulge, which has a luminosity larger than that from the disk by a
factor ∼ 5, is unknown. One needs to find a plausible source for
the production of positrons in the bulge. There is no unique answer
to this problem at present, but Type Ia supernovae and energetic
processes near low-mass X-ray binaries are prime candidates for
this source.
2.3.5 The Galactic bulge
The Galactic bulge is the central thickening of
our Galaxy. Figure 1.2 shows another spiral galaxy from
its side, with its bulge clearly visible. Compared to that, the
bulge in the Milky Way is far more difficult to identify in the
optical, as can be seen in Fig. 2.1, owing to obscuration. However, in the
near-IR, it clearly sticks out (Fig. 1.8). The characteristic
scale-length of the bulge is ∼ 1 kpc. Owing to the strong
extinction in the disk, the bulge is best observed in the IR. The
extinction to the Galactic center in the visual is A V ∼ 28 mag. However, some
lines-of-sight close to the Galactic center exist where
A V is significantly smaller, so
that observations in optical and near-IR light are possible, e.g.,
in Baade’s Window, located about 4∘ below the Galactic
center at ℓ ∼ 1∘, for which
A V ∼ 2mag (also see
Sect. 2.6).
From the observations by COBE, and also from
Galactic microlensing experiments (see Sect. 2.5), we know that our
bulge has the shape of a peanut-shaped bar , with the major axis
pointing away from us by about 25∘. The scale-height of
the bulge is ∼ 400 pc, with an axis-ratio
of ∼ 1: 0. 35: 0. 26.
As is the case for the exponential profiles that
describe the light distribution in the disk, the functional form of
the brightness distribution in the bulge is also suggested from
observations of other spiral galaxies. The profiles of their
bulges, observed from the outside, are much better determined than
in our Galaxy where we are located amid its stars.
The de Vaucouleurs
profile. The brightness profile of our bulge can be
approximated by the de Vaucouleurs law which describes the surface
brightness I as a function
of the projected distance R
from the center,
![$$\displaystyle{ \fbox{$\log \left (\frac{I(R)} {I_{\mathrm{e}}} \right ) = -3.3307\left [\left ( \frac{R} {R_{\mathrm{e}}}\right )^{1/4} - 1\right ]$}\;, }$$](A129044_2_En_2_Chapter_Equ40.gif) with I(R) being the measured surface
brightness, e.g., in
with I(R) being the measured surface
brightness, e.g., in ![$$[I] = L_{\odot }/\mathrm{pc}^{2}$$](A129044_2_En_2_Chapter_IEq57.gif) . R e is the effective radius,
defined such that half of the luminosity is emitted from within
R e,
. R e is the effective radius,
defined such that half of the luminosity is emitted from within
R e,

(2.40)
. R e is the effective radius,
defined such that half of the luminosity is emitted from within
R e,
(2.41)
This definition of R e also leads to the
numerical factor on the right-hand side of (2.40). As one can easily
see from (2.40), I e = I(R e) is the surface
brightness at the effective radius. An alternative form of the de
Vaucouleurs law is
![$$\displaystyle{ \fbox{$I(R) = I_{\mathrm{e}}\,\exp \left (-7.669\left [(R/R_{\mathrm{e}})^{1/4} - 1\right ]\right )$}\;. }$$](A129044_2_En_2_Chapter_Equ42.gif)
(2.42)
Because of its mathematical form, it is also
called an r 1∕4
law. The r 1∕4
law falls off significantly more slowly than an exponential law for
large R. For the Galactic
bulge, one finds an effective radius of R e ≈ 0. 7 kpc. With the de
Vaucouleurs profile, a relation between luminosity, effective
radius, and surface brightness is obtained by integrating over the
surface brightness,

(2.43)

Fig. 2.16
The ratio of magnesium and iron, as a
function of metallicity [Fe/H]. Filled grey circles correspond to bulge
stars, red (blue) circles show nearby stars from the
thick (thin) disk. The dotted
lines corresponds to the Solar value. Source: T. Bensby et
al. 2013, Chemical evolution of
the Galactic bulge as traced by microlensed dwarf and subgiant
stars. V. Evidence for a wide age distribution and a complex
MDF, A&A 549, A147, Fig. 27. ©ESO. Reproduced with
permission
Stellar age
distribution in the bulge.
The stars in the bulge cover a large range in
metallicity, ![$$-1 \lesssim [\mathrm{Fe}/\mathrm{H}] \lesssim +0.6$$](A129044_2_En_2_Chapter_IEq58.gif) ,
with a mean of about 0.3, i.e., the mean metallicity is about twice
that of the Sun. The metallicity also changes as a function of
distance from the center, with more distant stars having a smaller
value of [Fe/H].
,
with a mean of about 0.3, i.e., the mean metallicity is about twice
that of the Sun. The metallicity also changes as a function of
distance from the center, with more distant stars having a smaller
value of [Fe/H].
,
with a mean of about 0.3, i.e., the mean metallicity is about twice
that of the Sun. The metallicity also changes as a function of
distance from the center, with more distant stars having a smaller
value of [Fe/H].The high metallicity means that either the stars
of the bulge formed rather late, according to the age-metallicity
relation, or that it is an old population with very intense star
formation activities at an early cosmic epoch. We can distinguish
between these two possibilities from the chemical composition of
stars in the bulge, obtained from spectroscopy. This is shown in
Fig. 2.16,
where the magnesium-to-iron ratio is shown for stars in the bulge
and compared to disk stars. Obviously, bulge stars have a
significantly higher abundance of Mg, relative to iron, than the
stars from the thin disk, but much more similar to thick disk
stars. Recalling the discussion of the chemical enrichment of the
interstellar medium by supernovae in Sect. 2.3.2, this implies that
the enrichment must have occurred predominantly by core-collapse
supernovae, since they produce a high ratio of α-elements (like magnesium) compared to
iron, whereas Type Ia SNe produce mainly iron-group elements.
Therefore, most of the bulge stars must have formed before the Type
Ia SNe exploded. Whereas the time lag between the birth of a
stellar population and the explosion of the bulk of Type Ia SN is
not well known (it depends on the evolution of binary systems), it
is estimated to be between 1 and 3 Gyr. Hence, most of the bulge
stars must have formed on a rather short time-scale: the bulge
consists mainly of an old stellar population, formed
within ∼ 1 Gyr. This is also confirmed with the color-magnitude
diagram of bulge stars from which an age of 10 ± 2. 5 Gyr is
determined.
However, in the region of the bulge, one also
finds stars that kinematically belong to the disk and the halo, as
both extend to the inner region of the Milky Way. The thousands of
RR Lyrae stars found in the bulge, for example, have a much lower
metallicity than typical bulge stars and may well belong to the
innermost region of the stellar halo, and younger stars may be part
of the disk population.
The mass of the bulge is about  and its luminosity is
  ,
which results in a stellar mass-to-light ratio of
,
which results in a stellar mass-to-light ratio of
 larger than that of the thin disk.
and its luminosity is ,
which results in a stellar mass-to-light ratio of
(2.44)
2.3.6 The stellar halo
The visible halo of our Galaxy consists of about
150 globular clusters and
field stars with a high velocity component perpendicular to the
Galactic plane. A globular cluster is a collection of typically
several hundred thousand stars, contained within a spherical region
of radius ∼ 20 pc. The stars in the cluster are gravitationally
bound and orbit in the common gravitational field. The old globular
clusters with ![$$[\mathrm{Fe/H}] <-0.8$$](A129044_2_En_2_Chapter_IEq61.gif) have an approximately
spherical distribution around the Galactic center. A second
population of globular clusters exists that contains younger stars
with a higher metallicity,
have an approximately
spherical distribution around the Galactic center. A second
population of globular clusters exists that contains younger stars
with a higher metallicity, ![$$[\mathrm{Fe/H}]> -0.8$$](A129044_2_En_2_Chapter_IEq62.gif) . They have a more oblate
geometrical distribution and are possibly part of the thick disk
because they show roughly the same scale-height. The total mass of
the stellar halo in the radius range between 1 and 40 kpc is
. They have a more oblate
geometrical distribution and are possibly part of the thick disk
because they show roughly the same scale-height. The total mass of
the stellar halo in the radius range between 1 and 40 kpc is
 .
.
have an approximately
spherical distribution around the Galactic center. A second
population of globular clusters exists that contains younger stars
with a higher metallicity, . They have a more oblate
geometrical distribution and are possibly part of the thick disk
because they show roughly the same scale-height. The total mass of
the stellar halo in the radius range between 1 and 40 kpc is
.Most globular clusters are at a distance of
r ≲ 35 kpc (with
 ) from the Galactic
center, but some are also found at r > 60 kpc. At these distances it is
hard to judge whether these objects are part of the Galaxy or
whether they have been captured from a neighboring galaxy, such as
the Magellanic Clouds. Also, field stars have been found at
distances out to r ∼ 50 kpc, which is the reason why one
assumes a characteristic value of r halo ∼ 50 kpc for the
extent of the visible halo.
) from the Galactic
center, but some are also found at r > 60 kpc. At these distances it is
hard to judge whether these objects are part of the Galaxy or
whether they have been captured from a neighboring galaxy, such as
the Magellanic Clouds. Also, field stars have been found at
distances out to r ∼ 50 kpc, which is the reason why one
assumes a characteristic value of r halo ∼ 50 kpc for the
extent of the visible halo.The density
distribution of metal-poor globular clusters and field stars
in the halo is described by

(2.45)
with a slope γ in the range 3–3.5. Alternatively,
one can fit a de Vaucouleurs profile to the density distribution,
which results in an effective radius of r e ∼ 2. 7 kpc. Star counts
from the Sloan Digital Sky Survey provided clear indications that
the stellar halo of the Milky Way is flattened, i.e., it is oblate,
with an axis ratio of the smallest axis (in the direction of the
rotation axis) to the longer ones being q ∼ 0. 6.
Furthermore, the SDSS discovered the fact that
the stellar halo is highly structured: the distribution of stars in
the halo is not smooth, but local over- and underdensities are
abundant. Several so-called stellar streams were found, regions of
stellar overdensities with the shape of a long and narrow cylinder.
These stellar streams can in some cases be traced back to the
disruption of a low-mass satellite galaxy of the Milky Way by tidal
gravitational forces, most noticeably to the Sagittarius dwarf
spheroidal (Sgr dSph).
Tidal
disruption. Consider a system of gravitationally bound
particles, such as a star cluster, a star, or a gas cloud, moving
in a gravitational field. The trajectory of the system is
determined by the gravitational acceleration. However, since the
system is extended, particles in the outer part of the system
experience a different gravitational acceleration than the center
of mass. Hence, in the rest frame of the moving system, there is a
net acceleration of the particles away from the center, due to
tidal gravitational forces. The best-known example of this are the
tides on Earth: whereas the Earth is freely falling in the
gravitational field caused by the Sun (and the Moon), matter on its
surface experiences a net force, since the gravitational field is
inhomogeneous, giving rise to the tides. If this net force for
particles in the outer part of the system is directed outwards, and
stronger than the gravitational force binding the particles to the
system, these particles will be removed from the system—the system
will lose particles due to this tidal stripping.

Fig. 2.17
Tidal disruption of the globular cluster
Palomar 5. Left panel: The
white blob shows the globular cluster, from which the two tidal
tails emerge, shown in orange. These contain more mass than
the cluster itself at the current epoch, meaning the cluster has
lost more than half its original mass. The tidal tails delineate
the cluster’s orbit around the Galaxy, which is sketched in the
right panel as the
red curve, with the current
position of Pal 5 indicated in green. Credit: M. Odenkirchen, E.
Grebel, Max-Planck-Institut für Astronomie, and the Sloan Digital
Sky Survey Collaboration
Condition for
tidal disruption. We can consider this process more
quantitatively. Consider a spherical system of mass M and radius R, so the gravitational acceleration on
the surface is  , directed inwards. If
 is the gravitational
potential in which this system moves, the tidal acceleration
is the gravitational
potential in which this system moves, the tidal acceleration
 is the difference
between the acceleration −∇ϕ at the surface of the system and that
at its center,
is the difference
between the acceleration −∇ϕ at the surface of the system and that
at its center,
 where
where  is a vector from the center of the
system to its surface, i.e.,
is a vector from the center of the
system to its surface, i.e.,  . A first-order
Taylor expansion of the term on the r.h.s. yields for the
i-component of the tidal
acceleration
. A first-order
Taylor expansion of the term on the r.h.s. yields for the
i-component of the tidal
acceleration
 where we made use of the fact that
  , and the derivatives
are taken at the center of the system. In the final step, we
abbreviated the matrix of second partial derivatives of
ϕ with ϕ , ij . This matrix is symmetric,
and therefore one can always rotate to a coordinate system in which
this matrix is diagonal. We will assume now that the local matter
density ρ causing the
potential ϕ vanishes; then,
from the Poisson equation ∇2 ϕ = 4π
G ρ, we find that the sum of the diagonal elements of
ϕ , ij is zero. Furthermore, we
assume that the tidal field is axially symmetric, with the
r 1-axis being
the axis of symmetry. In this case, we can write the tidal matrix
as
, and the derivatives
are taken at the center of the system. In the final step, we
abbreviated the matrix of second partial derivatives of
ϕ with ϕ , ij . This matrix is symmetric,
and therefore one can always rotate to a coordinate system in which
this matrix is diagonal. We will assume now that the local matter
density ρ causing the
potential ϕ vanishes; then,
from the Poisson equation ∇2 ϕ = 4π
G ρ, we find that the sum of the diagonal elements of
ϕ , ij is zero. Furthermore, we
assume that the tidal field is axially symmetric, with the
r 1-axis being
the axis of symmetry. In this case, we can write the tidal matrix
as  . Writing the
radius vector as
. Writing the
radius vector as  ,
i.e., restricting it to the r 1-r 2-plane, the tidal
acceleration becomes
,
i.e., restricting it to the r 1-r 2-plane, the tidal
acceleration becomes  .
The radial component of the tidal acceleration is obtained by
projecting
.
The radial component of the tidal acceleration is obtained by
projecting  along the radial
direction,
along the radial
direction,
 The total radial acceleration is then

, directed inwards. If
is the gravitational
potential in which this system moves, the tidal acceleration
is the difference
between the acceleration −∇ϕ at the surface of the system and that
at its center,
is a vector from the center of the
system to its surface, i.e., . A first-order
Taylor expansion of the term on the r.h.s. yields for the
i-component of the tidal
acceleration
, and the derivatives
are taken at the center of the system. In the final step, we
abbreviated the matrix of second partial derivatives of
ϕ with ϕ , ij . This matrix is symmetric,
and therefore one can always rotate to a coordinate system in which
this matrix is diagonal. We will assume now that the local matter
density ρ causing the
potential ϕ vanishes; then,
from the Poisson equation ∇2 ϕ = 4π
G ρ, we find that the sum of the diagonal elements of
ϕ , ij is zero. Furthermore, we
assume that the tidal field is axially symmetric, with the
r 1-axis being
the axis of symmetry. In this case, we can write the tidal matrix
as . Writing the
radius vector as ,
i.e., restricting it to the r 1-r 2-plane, the tidal
acceleration becomes .
The radial component of the tidal acceleration is obtained by
projecting along the radial
direction,
If this is positive, the net force on a particle
is directed outwards, and the particle is stripped from the system.
Obviously, a
tid,r depends on the position on the surface, here
described by θ. Note that
the radial component of the tidal acceleration is symmetric under
θ → θ +π, i.e., is the same at opposite points
on the sphere. This is in agreement with the observation that the
tide gauge has two maxima and two minima at any time on the Earth
surface, so that the period of the tidal motion is 12 h, i.e., half
a day. Also note that in some regions on the surface, the tidal
acceleration is directed inwards, and directed outwards at other
points. If there is one point where the total radial acceleration
is positive, i.e., directed outwards, the system will lose mass.
Assuming t > 0, this
happens if 2tR > GM∕R 2. In other words, for a
system to be stable against tidal stripping, one must have

(2.46)
where in the final expression we inserted the
mean density  of the system. Hence, for a given mean density of a system, the
tidal gravitational field must not be larger
than (2.46) in order for the system to remain stable
against tidal stripping.
of the system. Hence, for a given mean density of a system, the
tidal gravitational field must not be larger
than (2.46) in order for the system to remain stable
against tidal stripping.
of the system. Hence, for a given mean density of a system, the
tidal gravitational field must not be larger
than (2.46) in order for the system to remain stable
against tidal stripping.One application of the foregoing treatment is the
disruption of a system in the field of a point mass M p, given by  .
If we choose the system to be located on the r 1-axis, the tidal matrix
ϕ , ij is diagonal and reads
.
If we choose the system to be located on the r 1-axis, the tidal matrix
ϕ , ij is diagonal and reads

.
If we choose the system to be located on the r 1-axis, the tidal matrix
ϕ , ij is diagonal and reads
Thus, the system is disrupted if
 We will return to this example when we consider the tidal
disruption of stars in the gravitational field of a black
hole.
We will return to this example when we consider the tidal
disruption of stars in the gravitational field of a black
hole.
(2.47)
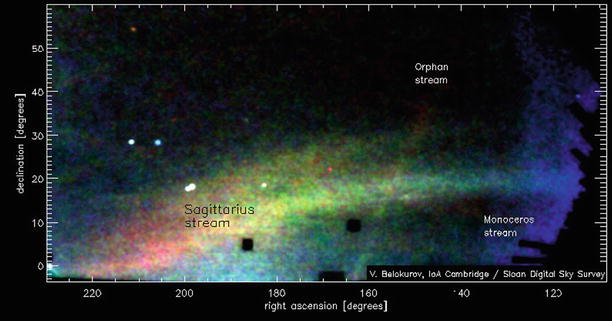
Fig. 2.18
The “Field of Streams”, as detected in the
SDSS survey. Shown is the two-dimensional distribution of stars,
which were color selected by g − r < 0. 4, and magnitude selected by
19 ≤ r ≤ 22. The color
selection yields the bluest stars in an old stellar population
corresponding to those whose main-sequence lifetime equals the age
of the population; hence, they are main sequence turn-off stars.
The range in magnitude then corresponds to a corresponding range in
distance. The distances are color-coded in this figure, with
blue corresponding to the
nearest stars at D ∼ 10 kpc, and red to the most distant ones at
D ∼ 30 kpc. One sees that
the density of stars is far from uniform, but that several almost
one-dimensional overdensities are easily identified. The most
prominent of these streams, the Sagittarius stream, corresponds to
stars which have been tidally stripped from the Sgr dSph. There is
a clear distance gradient along the stream visible, with the most
distant stars in the lower left of the image. Note that this image
covers almost a quarter of the sky. Credit: Vasily Belokurov,
SDSS-II Collaboration
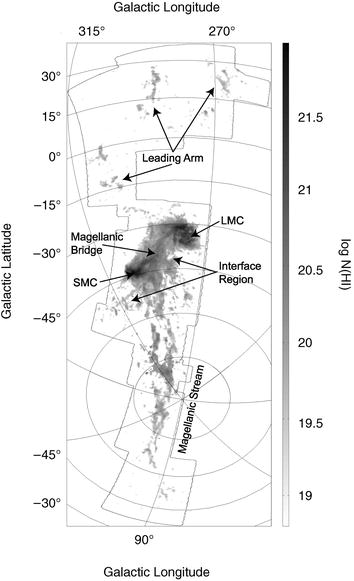
Fig. 2.19
Hi-map of a large region in the sky
containing the Magellanic Clouds. This map is part of a large
survey of Hi, observed
through its 21 cm line emission, that was performed with the Parkes
telescope in Australia, and which maps about a quarter of the
Southern sky with a pixel size of 5′ and a velocity resolution
of ∼ 1 km∕s. The emission from gas at Galactic velocities was
removed in this map. Besides the Hi emission by the Magellanic Clouds
themselves, gas between them is visible, the Magellanic Bridge and
the Magellanic Stream, the latter connected to the Magellanic
Clouds by an ‘Interface Region’. Gas is also found in the direction
of the orbital motion of the Magellanic Clouds around the Milky
Way, forming the ‘Leading Arm’. Source: C. Brüns et al. 2005,
The Parkes H i Survey of the Magellanic System,
A&A 432, 45, p. 50, Fig. 2. ©ESO. Reproduced with
permission
On its orbit through the Milky Way, a satellite
galaxy or a star cluster will experience a tidal force which varies
with time. When it gets closer to the center, or to the disk, one
expects the tidal field to get stronger than on other parts of the
orbit. Depending on its mean density and its orbit, such a system
will lose mass in the course of time. This is impressively seen in
the globular cluster Pal 5, where the SDSS has found two massive
tidal tails of stars that were removed from the cluster due to
tidal forces (Fig. 2.17). The 180∘-symmetry of the
tidal force mentioned before leads to the occurrence of two almost
symmetric tidal tails, one moving slightly faster than the cluster
(the leading tail), the other slower (trailing tail). The tidally
stripped stars form such coherent structures since their velocity
dispersion is very small, comparable to the velocity dispersion of
the globular cluster. This explains why such tidal streams form a
distinct feature for a long time. Since the tidal tails of Pal 5
contain more stellar mass than the remaining cluster, the latter
has lived through the best part of its life and will be totally
disrupted within its next few orbits around the Galactic
center.
As mentioned above, other stellar streams similar
to that of Pal 5 have been found, the clearest one being that
related to the tidal disruption of Sgr dSph. The corresponding
tidal stream is observed to create a full great circle on the sky;
a part of it is shown in Fig. 2.18.
As we will discuss later (see Chap. 10), the strong substructure of the
stellar halo is expected from our understanding of the evolution of
galaxies where galaxies grow in mass through mergers with other
galaxies. In this model, the observed substructure are remnants of
low-mass galaxies which were accreted onto the Milky Way at some
earlier time—in agreement with the discussion above on the possible
origin of the thick disk.
2.3.7 The gaseous halo
Besides a stellar component, also gas in various
phases is seen outside the disk of the Milky Way. The gas is
detected either by its emission or by absorption lines in the
spectra of sources located at larger distances. When observing gas,
either in emission or absorption, its distance to us is at first
unknown, and must be inferred indirectly.
Infalling gas
clouds. Neutral hydrogen is observed outside the Galactic
disk, in the form of clouds. Most of these clouds, visible in 21 cm
line emission, have a negative radial velocity, i.e., they are
moving towards us, with velocities of up to  . Based on
their observed velocity, these high-velocity clouds (HVCs) cannot be
following the general Galactic rotation. In addition, there are
clouds with smaller velocities, the intermediate-velocity clouds
(IVCs).
. Based on
their observed velocity, these high-velocity clouds (HVCs) cannot be
following the general Galactic rotation. In addition, there are
clouds with smaller velocities, the intermediate-velocity clouds
(IVCs).
. Based on
their observed velocity, these high-velocity clouds (HVCs) cannot be
following the general Galactic rotation. In addition, there are
clouds with smaller velocities, the intermediate-velocity clouds
(IVCs).These clouds are often organized in big
structures on the sky, the largest of which are located close to
the Magellanic Clouds (Fig. 2.19). This gas forms the Magellanic Stream, a
narrow band of Hi
emission which follows the Magellanic Clouds along their orbit
around the Galaxy (see Fig. 2.20). This gas stream may be the result of a
close encounter of the Magellanic Clouds with the Milky Way in the
past. The (tidal) gravitational force that the Milky Way had
imposed on our neighboring galaxies in such an encounter could
strip away part of their interstellar gas. For the Magellanic
Stream, the distance can be assumed to coincide with the distance
to the Magellanic Clouds.
For the other HVCs, which are not associated with
a stellar structure, distances can be estimated through absorption.
If we consider a set of stars near to the line-of-sight to a
hydrogen cloud, located at different distances from us, then those
at distances larger than the gas will show absorption lines caused
by the gas (with the same radial velocity, or Doppler shift, as the
emission of the gas), and those which are closer will not. Hence,
from the interstellar absorption lines of stars in the Galactic
halo, the distances to the HVCs can be inferred. These studies
became possible after the Sloan Digital Sky Survey, and other
imaging surveys, identified a large number of halo stars, so that
we now have a pretty good three-dimensional picture of this gas
distribution.
Most of the HVCs are at distances between 2 and
15 kpc from us, and within ∼ 10 kpc of the Galactic disk. Based on
the line width, indicating the thermal velocity of the gas, its
temperature is characteristic of a warm neutral medium,
T ∼ 104 K, but
narrower line components in some HVCs show that cooled gas must be
present as well. This neutral hydrogen has a large covering
fraction, i.e., more than a third of our sky is covered down to a
column density of 2 × 1017 cm−2 in neutral
hydrogen atoms.
The neutral gas in the HVCs is often associated
with optical emission in the Hα line. This emission line is produced
in the process of hydrogen recombination, from which one concludes
that the hydrogen clouds are partially ionized, most likely due to
ionizing radiation from hot stars in the Galactic disk. The total
mass contained in the HVCs can be estimated to amount to ∼ 7 ×
107 M
⊙, if it is assumed that their neutral fraction overall
is about 50 %. The hydrogen gas associated with the Magellanic
Stream contains a mass at least four times this value.
Warm and hot
gas. Beside the relatively cold neutral gas seen in the
HVCs, there is hotter gas at large distances from the Galactic
plane. Gas with temperatures of T ∼ 105 K is observed
through absorption lines of highly ionized species in optical and
UV spectra of distance sources, like quasars. Indeed, a covering
fraction larger than ∼ 60 %
is found for absorption by doubly ionized silicon (Siii) and by five times ionized
oxygen (Ovi). The
temperature of the gas can be estimated if several different ions
are detected in absorption; this then also allows one to determine
the total column density of gas. It is estimated that this gas
component has a metallicity of ∼ 0. 2 Solar, and a total mass
of ∼ 108 M
⊙.
Hotter gas, with T ∼ 106 K, is seen from its
X-ray emission, as well as through absorption lines of
Ovii and Oviii. Most of this gas that we see
in emission is believed to be within a few kiloparsecs of the
Galactic disk, but there is evidence that some gas extends to
larger distances. The presence of this hot gas component is also
evidenced by the morphology of some HVCs, which show a head-tail
structure (not unlike that of comets), best explained if the
hydrogen cloud moves through an ambient medium which compresses its
head, and gradually strips off gas from the cloud, which forms the
tail.

Fig. 2.20
The image
on top displays the neutral hydrogen distribution belonging
to the Magellanic Stream, shown in pink, projected onto an optical image
of the sky. The Magellanic Clouds are the two white regions at the right of the
region marked with the blue
box. The filamentary gas ‘above’ the Magellanic Clouds is
called the ‘leading arm’, whereas most of the gas between the LMC
and SMC is often called the Magellanic Bridge, and the gas
connecting this with the Magellanic Stream is called interface
region. The bottom image is
a 21 cm radio map of the that marked region, obtained as part of
the Leiden-Argentine-Bonn (LAB) Survey. The crosses mark active
galactic nuclei for which UV-spectra were obtained with the Cosmic
Origins Spectrograph (COS) onboard HST, to measure the absorption
caused by the gas. In particular, the metallicity and chemical
composition of the gas was determined. Comparison with the chemical
composition of the LMC and SMC shows that the gas of the Magellanic
Stream most likely originated from the SMC, from which it was
removed by ram-pressure and tidal stripping, though part of the
Magellanic Stream was also contributed by the LMC. Credit: David L.
Nidever et al., NRAO/AUI/NSF and A. Mellinger,
Leiden-Argentine-Bonn (LAB) Survey, Parkes Observatory, Westerbork
Observatory, and Arecibo Observatory
The gas visible outside the disk constitutes
about 10 % of the total interstellar medium in the Milky Way and
thus presents a significant reservoir of gas. Some of this gas is
believed to have been expelled from the Galactic disk, through
outflows generated by supernova explosions, based on theoretical
expectations and on the measured high metallicity. This gas cools
by adiabatic expansion, and returns to the disk under the influence
of gravity; this is thought to be a possible origin of IVCs. Since
the flow of this gas resembles that of water in a fountain, this
scenario is often called the galactic fountain model.
Low-metallicity gas, mainly the HVCs, may be coming from outside
the Galaxy and be falling into its gravitational potential for the
first time. This would then be a fresh supply of gas, out of which
stars will be able to form in the future. Indeed, we believe that
the mass of the Milky Way is growing also through this accretion of
gas, and this is one of the elements of the models of galaxy
evolution that we will discuss in Chap. 10. The inflow of gas is estimated to
be a few M ⊙ per
year, comparable to the star-formation rate in the Milky Way.
2.3.8 The distance to the Galactic center
As already mentioned, our distance from the
Galactic center is rather difficult to measure and thus not very
precisely known. The general problem with such a measurement is the
high extinction in the disk, prohibiting measurements of the
distance of individual stars close to the Galactic center. Thus,
one has to rely on more indirect methods, and the most important
ones will be outlined here.
The visible halo of our Milky Way is populated by
globular clusters and also by field stars. They have a spherical,
or, more generally, a spheroidal distribution. The center of this
distribution is obviously identified with the center of gravity of
the Milky Way, around which the halo objects are moving. If one
measures the three-dimensional distribution of the halo population,
the geometrical center of this distribution should correspond to
the Galactic center.

Fig. 2.21
The number of RR Lyrae stars as a function
of distance, measured in a direction that closely passes the
Galactic center, at ℓ = 0∘ and  . If we assume a spherically
symmetric distribution of the RR Lyrae stars, concentrated towards
the center, the distance to the Galactic center can be identified
with the maximum of this distribution. Source: M. Reid 1993,
The distance to the center of the
Galaxy, ARA&A 31, 345, p. 355. Reprinted, with
permission, from the Annual Review
of Astronomy & Astrophysics, Volume 31 ©1993 by Annual
Reviews www.annualreviews.org
. If we assume a spherically
symmetric distribution of the RR Lyrae stars, concentrated towards
the center, the distance to the Galactic center can be identified
with the maximum of this distribution. Source: M. Reid 1993,
The distance to the center of the
Galaxy, ARA&A 31, 345, p. 355. Reprinted, with
permission, from the Annual Review
of Astronomy & Astrophysics, Volume 31 ©1993 by Annual
Reviews www.annualreviews.orgThis method can indeed be applied because, due to
their extended distribution, halo objects can be observed at
relatively large Galactic latitudes where they are not too strongly
affected by extinction. As was discussed in Sect. 2.2, the distance
determination of globular clusters is possible using photometric
methods. On the other hand, one also finds RR Lyrae stars in
globular clusters to which the period-luminosity relation can be
applied. Therefore, the spatial distribution of the globular
clusters can be determined. However, at about 150, the number of
known globular clusters is relatively small, resulting in a fairly
large statistical error for the determination of the common center.
Much more numerous are the RR Lyrae field stars in the halo, for
which distances can be measured using the period-luminosity
relation. The statistical error in determining the center of their
distribution is therefore much smaller. On the other hand, this
distance to the Galactic center is based only on the calibration of
the period-luminosity relation, and any uncertainty in this will
propagate into a systematic error on R 0. Effects of the
extinction add to this. However, such effects can be minimized by
observing the RR Lyrae stars in the NIR, which in addition benefits
from the narrower luminosity distribution of RR Lyrae stars in this
wavelength regime. These analyses yield a value of R 0 ≈ 8. 0 kpc (see
Fig. 2.21).
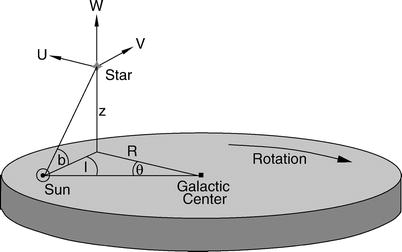
Fig. 2.22
Cylindrical coordinate system (R, θ, z) with the Galactic center at its
origin. Note that θ
increases in the clockwise direction if the disk is viewed from
above. The corresponding velocity components (U, V, W) of a star are indicated. Adopted
from B.W. Carroll & D.A. Ostlie 1996, Introduction to Modern Astrophysics,
Addison-Wesley
2.4 Kinematics of the Galaxy
Unlike a solid body, the Galaxy rotates
differentially. This means that the angular velocity is a function
of the distance R from the
Galactic center. Seen from above, i.e., from the NGP, the rotation
is clockwise. To describe the velocity field quantitatively we will
in the following introduce velocity components in the coordinate
system (R, θ, z), as shown in Fig. 2.22. An object following
a track [R(t), θ(t), z(t)] then has the velocity components
 For example, the Sun is not moving on a simple circular orbit
around the Galactic center, but currently inwards, U < 0, and with W > 0, so that it is moving away
from the Galactic plane.
For example, the Sun is not moving on a simple circular orbit
around the Galactic center, but currently inwards, U < 0, and with W > 0, so that it is moving away
from the Galactic plane.
(2.48)
In this section we will examine the rotation of
the Milky Way. We start with the determination of the velocity
components of the Sun. Then we will consider the rotation curve of
the Galaxy, which describes the rotational velocity V (R) as a function of the distance
R from the Galactic center.
We will find the intriguing result that the velocity V does not decline towards large
distances, but that it virtually remains constant. Because this
result is of extraordinary importance, we will discuss the methods
needed to derive it in some detail.
2.4.1 Determination of the velocity of the Sun
Local standard of
rest. To link local measurements to the Galactic
coordinate system (R, θ, z), the local standard of rest is defined.
It is a fictitious rest-frame in which velocities are measured. For
this purpose, we consider a point that is located today at the
position of the Sun and that moves along a perfectly circular
orbit in the plane of the Galactic disk. The velocity components in
the LSR are then by definition,

(2.49)
with V
0 ≡ V
(R 0) being the
orbital velocity at the location of the Sun. Although the LSR
changes over time, the time-scale of this change is so large (the
orbital period is ∼ 230 × 106 yr) that this effect is
negligible.
Peculiar
velocity. The velocity of an object relative to the LSR is
called its peculiar velocity. It is denoted by  , and its components are given as

, and its components are given as
(2.50)
The velocity of the Sun relative to the LSR is
denoted by  . If
. If  is known, any velocity
measured relative to the Sun can be converted into a velocity
relative to the LSR: let
is known, any velocity
measured relative to the Sun can be converted into a velocity
relative to the LSR: let  be the velocity of a star
relative to the Sun, which is directly measurable using the methods
discussed in Sect. 2.2, then the peculiar velocity of this star is
be the velocity of a star
relative to the Sun, which is directly measurable using the methods
discussed in Sect. 2.2, then the peculiar velocity of this star is

. If is known, any velocity
measured relative to the Sun can be converted into a velocity
relative to the LSR: let be the velocity of a star
relative to the Sun, which is directly measurable using the methods
discussed in Sect. 2.2, then the peculiar velocity of this star is
(2.51)
Peculiar velocity
of the Sun. We consider now an ensemble of stars in the
immediate vicinity of the Sun, and assume the Galaxy to be axially
symmetric and stationary. Under these assumptions, the number of
stars that move outwards to larger radii R equals the number of stars moving
inwards. Likewise, as many stars move upwards through the Galactic
plane as downwards. If these conditions are not satisfied, the
assumption of a stationary distribution would be violated. The mean
values of the corresponding peculiar velocity components must
therefore vanish,

(2.52)
where the brackets denote an average over the
ensemble considered. The analog argument is not valid for the
v component because the
mean value of v depends on
the distribution of the orbits: if only circular orbits in the disk
existed (with the same orientation as that of the Sun), we would
also have  (this is trivial,
since then all stars would have v = 0), but this is not the case. From
a statistical consideration of the orbits in the framework of
stellar dynamics, one deduces that
(this is trivial,
since then all stars would have v = 0), but this is not the case. From
a statistical consideration of the orbits in the framework of
stellar dynamics, one deduces that  is closely linked to
the radial velocity dispersion of the stars: the larger it is, the
more
is closely linked to
the radial velocity dispersion of the stars: the larger it is, the
more  deviates from zero.
One finds that
deviates from zero.
One finds that

(this is trivial,
since then all stars would have v = 0), but this is not the case. From
a statistical consideration of the orbits in the framework of
stellar dynamics, one deduces that is closely linked to
the radial velocity dispersion of the stars: the larger it is, the
more deviates from zero.
One finds that
(2.53)
where C
is a positive constant that depends on the density distribution and
on the local velocity distribution of the stars. The sign
in (2.53) follows from noting that a circular orbit
has a higher tangential velocity than elliptical orbits, which in
addition have a non-zero radial component.
Equation (2.53) expresses the fact that the mean
rotational velocity of a stellar population around the Galactic
center deviates from the corresponding circular orbit velocity, and
that the deviation is stronger for a larger radial velocity
dispersion. This phenomenon is also known as asymmetric drift. From
the mean of (2.51) over the ensemble considered and by
using (2.52) and (2.53), one obtains

(2.54)
One still needs to determine the constant
C in order to make use of
this relation. This is done by considering different stellar
populations and measuring  and
and  separately
for each of them. If these two quantities are then plotted in a
diagram (see Fig. 2.23), a linear relation is obtained, as
expected from (2.53). The slope C can be determined directly from this
diagram. Furthermore, from the intersection with the
separately
for each of them. If these two quantities are then plotted in a
diagram (see Fig. 2.23), a linear relation is obtained, as
expected from (2.53). The slope C can be determined directly from this
diagram. Furthermore, from the intersection with the  -axis,
 is readily read off. The other velocity components
in (2.54) follow by simply averaging, yielding the
result:
is readily read off. The other velocity components
in (2.54) follow by simply averaging, yielding the
result:

and separately
for each of them. If these two quantities are then plotted in a
diagram (see Fig. 2.23), a linear relation is obtained, as
expected from (2.53). The slope C can be determined directly from this
diagram. Furthermore, from the intersection with the -axis,
is readily read off. The other velocity components
in (2.54) follow by simply averaging, yielding the
result:
(2.55)
Hence, the Sun is currently moving inwards,
upwards, and faster than it would on a circular orbit at its
location. We have therefore determined  , so we are now able to
analyze any measured stellar velocities relative to the LSR.
However, we have not yet discussed how V 0, the rotational velocity
of the LSR itself, is determined.
, so we are now able to
analyze any measured stellar velocities relative to the LSR.
However, we have not yet discussed how V 0, the rotational velocity
of the LSR itself, is determined.
, so we are now able to
analyze any measured stellar velocities relative to the LSR.
However, we have not yet discussed how V 0, the rotational velocity
of the LSR itself, is determined.Velocity
dispersion of stars. The dispersion of the stellar
velocities relative to the LSR can now be determined, i.e., the
mean square deviation of their velocities from the velocity of the
LSR. For young stars (A stars, for example), this dispersion
happens to be small. For older K giants it is larger, and is larger
still for old, metal-poor red dwarf stars. We observe a very
well-defined velocity-metallicity relation which, when combined
with the age-metallicity relation, suggests that the oldest stars
have the highest peculiar velocities. This effect is observed in
all three coordinates and is in agreement with the relation between
the age of a stellar population and its scale-height (discussed in
Sect. 2.3.1),
the latter being linked to the velocity dispersion via σ z .
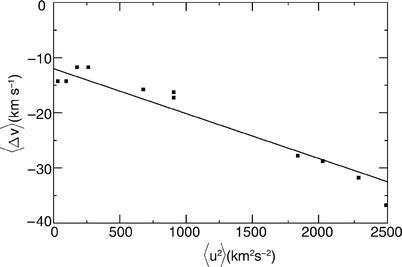
Fig. 2.23
The velocity components  are plotted against
  for stars in the
Solar neighborhood. Because of the linear relation, v ⊙ can be read off from the
intersection with the x-axis, and C from the slope. Adopted from B.W.
Carroll & D.A. Ostlie 1996, Introduction to Modern Astrophysics,
Addison-Wesley
for stars in the
Solar neighborhood. Because of the linear relation, v ⊙ can be read off from the
intersection with the x-axis, and C from the slope. Adopted from B.W.
Carroll & D.A. Ostlie 1996, Introduction to Modern Astrophysics,
Addison-Wesley
are plotted against for stars in the
Solar neighborhood. Because of the linear relation, v ⊙ can be read off from the
intersection with the x-axis, and C from the slope. Adopted from B.W.
Carroll & D.A. Ostlie 1996, Introduction to Modern Astrophysics,
Addison-Wesley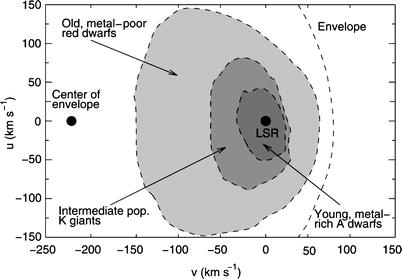
Fig. 2.24
The motion of the Sun around the Galactic
center is reflected in the asymmetric drift: while young stars in
the Solar vicinity have velocities very similar to the Solar
velocity, i.e., small relative velocities, members of other
populations (and of other Milky Way components) have different
velocities—e.g., for halo objects  on average. Thus, different
velocity ellipses show up in a (u − v)-diagram. Adopted from B.W. Carroll
& D.A. Ostlie 1996, Introduction to Modern Astrophysics,
Addison-Wesley
on average. Thus, different
velocity ellipses show up in a (u − v)-diagram. Adopted from B.W. Carroll
& D.A. Ostlie 1996, Introduction to Modern Astrophysics,
Addison-Wesley
on average. Thus, different
velocity ellipses show up in a (u − v)-diagram. Adopted from B.W. Carroll
& D.A. Ostlie 1996, Introduction to Modern Astrophysics,
Addison-WesleyAsymmetric
drift. If one considers high-velocity stars, only a few are
found that have v > 65 km∕s and which are thus
moving much faster around the Galactic center than the LSR.
However, quite a few stars are found that have  , so their orbital
velocity is opposite to the direction of rotation of the LSR.
Plotted in a (u −
v)-diagram, a distribution
is found which is narrowly concentrated around
, so their orbital
velocity is opposite to the direction of rotation of the LSR.
Plotted in a (u −
v)-diagram, a distribution
is found which is narrowly concentrated around  for young stars, as
already mentioned above, and which gets increasingly wider for
older stars. For the oldest stars, which belong to the halo
population, one obtains a circular envelope with its center located
at
for young stars, as
already mentioned above, and which gets increasingly wider for
older stars. For the oldest stars, which belong to the halo
population, one obtains a circular envelope with its center located
at  and
and  (see
Fig. 2.24).
If we assume that the Galactic halo, to which these high-velocity
stars belong, does not rotate (or only very slowly), this asymmetry
in the v-distribution can
only be caused by the rotation of the LSR. The center of the
envelope then has to be at − V 0. This yields the orbital
velocity of the LSR
(see
Fig. 2.24).
If we assume that the Galactic halo, to which these high-velocity
stars belong, does not rotate (or only very slowly), this asymmetry
in the v-distribution can
only be caused by the rotation of the LSR. The center of the
envelope then has to be at − V 0. This yields the orbital
velocity of the LSR
 Knowing this velocity, we can then compute the mass of the Galaxy
inside the Solar orbit. A circular orbit is characterized by an
equilibrium between centrifugal and gravitational acceleration,
Knowing this velocity, we can then compute the mass of the Galaxy
inside the Solar orbit. A circular orbit is characterized by an
equilibrium between centrifugal and gravitational acceleration,
 , so that

, so their orbital
velocity is opposite to the direction of rotation of the LSR.
Plotted in a (u −
v)-diagram, a distribution
is found which is narrowly concentrated around for young stars, as
already mentioned above, and which gets increasingly wider for
older stars. For the oldest stars, which belong to the halo
population, one obtains a circular envelope with its center located
at and (see
Fig. 2.24).
If we assume that the Galactic halo, to which these high-velocity
stars belong, does not rotate (or only very slowly), this asymmetry
in the v-distribution can
only be caused by the rotation of the LSR. The center of the
envelope then has to be at − V 0. This yields the orbital
velocity of the LSR
(2.56)
, so that
(2.57)
Furthermore, for the orbital period of the LSR,
which is similar to that of the Sun, one obtains

(2.58)
Hence, during the lifetime of the Solar System,
estimated to be ∼ 4. 6 × 10⁹ yr, it has completed about
20 orbits around the Galactic center.
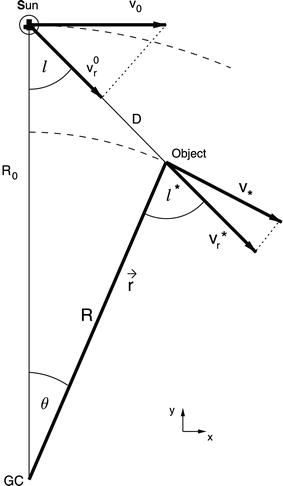
Fig. 2.25
Geometric derivation of the formalism of
differential rotation:

One has:

which implies

2.4.2 The rotation curve of the Galaxy
From observations of the velocity of stars or gas
around the Galactic center, the rotational velocity V can be determined as a function of
the distance R from the
Galactic center. In this section, we will describe methods to
determine this rotation
curve and discuss the result.
Decomposition of
rotational velocity. We consider an object at distance
R from the Galactic center
which moves along a circular orbit in the Galactic plane, has a
distance D from the Sun,
and is located at a Galactic longitude ℓ (see Fig. 2.4.1). In a Cartesian
coordinate system with the Galactic center at the origin, the
positional and velocity vectors (we only consider the two
components in the Galactic plane because we assume a motion in the
plane) are given by
 where θ denotes the angle
between the Sun and the object as seen from the Galactic center.
From the geometry shown in Fig. 2.4.1 it follows that
where θ denotes the angle
between the Sun and the object as seen from the Galactic center.
From the geometry shown in Fig. 2.4.1 it follows that

If we now identify the two expressions for the
components of  , we obtain
 If we disregard the difference between the velocities of the Sun
and the LSR we get
If we disregard the difference between the velocities of the Sun
and the LSR we get  in this coordinate system. Thus the relative velocity between the
object and the Sun is, in Cartesian coordinates,
in this coordinate system. Thus the relative velocity between the
object and the Sun is, in Cartesian coordinates,
 With the angular velocity defined as
 we obtain for the relative velocity

, we obtain
in this coordinate system. Thus the relative velocity between the
object and the Sun is, in Cartesian coordinates,
(2.59)
where  is the angular
velocity of the Sun. The radial and tangential velocities of this
relative motion then follow by projection of
is the angular
velocity of the Sun. The radial and tangential velocities of this
relative motion then follow by projection of  along the direction
parallel or perpendicular, respectively, to the separation vector,
along the direction
parallel or perpendicular, respectively, to the separation vector,


is the angular
velocity of the Sun. The radial and tangential velocities of this
relative motion then follow by projection of along the direction
parallel or perpendicular, respectively, to the separation vector,
(2.60)
(2.61)
A purely geometric derivation of these relations
is given in Fig. 2.4.1.
Rotation curve
near R 0 , Oort
constants. Using (2.60) one can derive the angular velocity by
means of measuring v
r, but not the radius R to which it corresponds. Therefore,
by measuring the radial velocity alone Ω(R) cannot be determined. If one
measures v r
and, in addition, the proper motion  of stars, then Ω and D can be determined from the equations
above, and from D and
ℓ one obtains
of stars, then Ω and D can be determined from the equations
above, and from D and
ℓ one obtains  .
The effects of extinction prohibits the use of this method for
large distances D, since we
have considered objects in the Galactic disk. For small distances
D ≪ R 0, which implies
.
The effects of extinction prohibits the use of this method for
large distances D, since we
have considered objects in the Galactic disk. For small distances
D ≪ R 0, which implies
 , we can make a local
approximation by evaluating the expressions above only up to first
order in
, we can make a local
approximation by evaluating the expressions above only up to first
order in  . In this linear approximation we
get
. In this linear approximation we
get

of stars, then Ω and D can be determined from the equations
above, and from D and
ℓ one obtains .
The effects of extinction prohibits the use of this method for
large distances D, since we
have considered objects in the Galactic disk. For small distances
D ≪ R 0, which implies
, we can make a local
approximation by evaluating the expressions above only up to first
order in . In this linear approximation we
get
(2.62)
where the derivative has to be evaluated at
R = R 0. Hence

and furthermore, with (2.59),
![$$\displaystyle{R_{0}\left ( \frac{\mathrm{d}\varOmega } {\mathrm{d}R}\right )_{\vert R_{0}} = \frac{R_{0}} {R} \left [\left (\frac{\mathrm{d}V } {\mathrm{d}R}\right )_{\vert R_{0}} -\frac{V } {R}\right ] \approx \left (\frac{\mathrm{d}V } {\mathrm{d}R}\right )_{\vert R_{0}} -\frac{V _{0}} {R_{0}} \;,}$$](A129044_2_En_2_Chapter_Equq.gif)
in zeroth order in  . Combining the last two equations
yields
. Combining the last two equations
yields
\sin \ell\;; }$$](A129044_2_En_2_Chapter_Equ66.gif) in analogy to this, we obtain for the tangential velocity
in analogy to this, we obtain for the tangential velocity
\cos \ell -\varOmega _{0}\,D\;. }$$](A129044_2_En_2_Chapter_Equ67.gif)
. Combining the last two equations
yields
(2.63)
(2.64)


where A
and B are the Oort constants
![$$\displaystyle\begin{array}{rcl} \fbox{$\begin{array}{cc} A&:= -\frac{1} {2}\left [\left (\frac{\mathrm{d}V } {\mathrm{d}R}\right )_{\vert R_{0}} -\frac{V _{0}} {R_{0}} \right ]\;, \\ B &:= -\frac{1} {2}\left [\left (\frac{\mathrm{d}V } {\mathrm{d}R}\right )_{\vert R_{0}} + \frac{V _{0}} {R_{0}} \right ]\;. \end{array} $}& &{}\end{array}$$](A129044_2_En_2_Chapter_Equ69.gif)
(2.66)
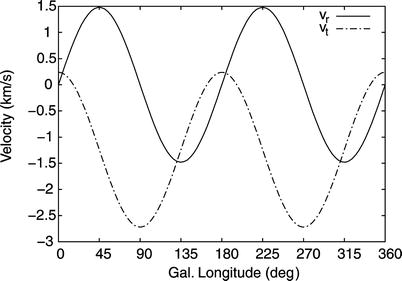
Fig. 2.26
The radial velocity v r of stars at a fixed
distance D is proportional
to sin2ℓ; the tangential
velocity v t is
a linear function of cos2ℓ.
From the amplitude of the oscillating curves and from the mean
value of v t the
Oort constants A and
B can be derived,
respectively [see (2.65)]
The radial and tangential velocity fields
relative to the Sun show a sine curve with period π, where v t and v r are phase-shifted by
π∕4. This behavior of the
velocity field in the Solar neighborhood is indeed observed (see
Fig. 2.26).
By fitting the data for v
r(ℓ) and
v t(ℓ) for stars of equal distance
D one can determine
A and B, and thus

(2.67)
The Oort constants thus yield the angular
velocity of the Solar orbit and its derivative, and therefore the
local kinematical information. If our Galaxy was rotating rigidly
so that Ω was independent
of the radius, A = 0 would
follow. But the Milky Way rotates differentially, i.e., the angular
velocity depends on the radius. Measurements yield the following
values for A and
B,

(2.68)

Fig. 2.27
The ISM is optically thin for 21 cm
radiation, and thus we receive the 21 cm emission of Hi regions from everywhere in the
Galaxy. Due to the motion of an Hi cloud relative to us, the
wavelength is shifted. This can be used to measure the radial
velocity of the cloud. With the assumption that the gas is moving
on a circular orbit around the Galactic center, one expects that
for the cloud in the tangent point (cloud 4), the full velocity is
projected along the line-of-sight so that this cloud will therefore
have the largest radial velocity. If the distance of the Sun to the
Galactic center is known, the velocity of a cloud and its distance
from the Galactic center can then be determined. Adopted from B.W.
Carroll & D.A. Ostlie 1996, Introduction to Modern Astrophysics,
Addison-Wesley
Galactic rotation
curve for R < R 0 ; tangent point method. To measure the
rotation curve for radii that are significantly smaller than
R 0, one has to
turn to large wavelengths due to extinction in the disk. Usually
the 21 cm emission line of neutral hydrogen is used, which can be
observed over large distances, or the emission of CO in molecular
gas. These gas components are found throughout the disk and are
strongly concentrated towards the plane. Furthermore, the radial
velocity can easily be measured from the Doppler effect. However,
since the distance to a hydrogen cloud cannot be determined
directly, a method is needed to link the measured radial velocities
to the distance of the gas from the Galactic center. For this
purpose the tangent point
method is used.
Consider a line-of-sight at fixed Galactic
longitude ℓ, with
cosℓ > 0 (thus
‘inwards’). The radial velocity v r along this line-of-sight
for objects moving on circular orbits is a function of the distance
D, according
to (2.60). If Ω(R) is a monotonically decreasing
function, v r
attains a maximum where the line-of-sight is tangent to the local
orbit, and thus its distance R from the Galactic center attains the
minimum value R
min. This is the case at
 (see Fig. 2.27). The maximum radial velocity there,
according to (2.60), is
(see Fig. 2.27). The maximum radial velocity there,
according to (2.60), is
![$$\displaystyle\begin{array}{rcl} v_{\mathrm{r,max}} = \left [\varOmega (R_{\mathrm{min}}) -\varOmega _{0}\right ]\,R_{0}\,\sin \ell = V (R_{\mathrm{min}}) - V _{0}\,\sin \ell\;,& &{}\end{array}$$](A129044_2_En_2_Chapter_Equ73.gif) so that from the measured value of v r,max as a function of
direction ℓ, the rotation
curve inside R 0
can be determined,
so that from the measured value of v r,max as a function of
direction ℓ, the rotation
curve inside R 0
can be determined,
 In the optical regime of the spectrum this method can only be
applied locally, i.e., for small D, due to extinction. This is the case
if one observes in a direction nearly tangential to the orbit of
the Sun, i.e., if
In the optical regime of the spectrum this method can only be
applied locally, i.e., for small D, due to extinction. This is the case
if one observes in a direction nearly tangential to the orbit of
the Sun, i.e., if  or
or  , or | sinℓ | ≈ 1, so that
  . In this case we
get, to first order in (R
0 − R
min), using (2.69),
. In this case we
get, to first order in (R
0 − R
min), using (2.69),

(2.69)
(2.70)
(2.71)
or , or | sinℓ | ≈ 1, so that . In this case we
get, to first order in (R
0 − R
min), using (2.69),
(2.72)
so that with (2.70)
 \\ & = 2\,A\,R_{0}\,(1-\sin \ell)\;, \end{array} $}& &{}\end{array}$$](A129044_2_En_2_Chapter_Equ76.gif)
(2.73)
where (2.66) was used in the last step. This relation
can also be used for determining the Oort constant A.
To determine V (R) for smaller R by employing the tangent point
method, we have to observe in wavelength regimes in which the
Galactic plane is transparent, using radio emission lines of gas.
In Fig. 2.27,
a typical intensity profile of the 21 cm line along a line-of-sight
is sketched; according to the Doppler effect this can be converted
directly into a velocity profile using  .
It consists of several maxima that originate in individual gas
clouds. The radial velocity of each cloud is defined by its
distance R from the
Galactic center (if the gas follows the Galactic rotation), so that
the largest radial velocity will occur for gas closest to the
tangent point, which will be identified with v r,max(ℓ). Figure 2.28 shows the observed
intensity profile of the12CO line as a function of the
Galactic longitude, from which the rotation curve for R < R 0 can be read off.
.
It consists of several maxima that originate in individual gas
clouds. The radial velocity of each cloud is defined by its
distance R from the
Galactic center (if the gas follows the Galactic rotation), so that
the largest radial velocity will occur for gas closest to the
tangent point, which will be identified with v r,max(ℓ). Figure 2.28 shows the observed
intensity profile of the12CO line as a function of the
Galactic longitude, from which the rotation curve for R < R 0 can be read off.
Fig. 2.28
12CO emission of molecular gas
in the Galactic disk. For each ℓ, the intensity of the emission in the
ℓ − v r plane is plotted,
integrated over the range − 2∘ ≤ b ≤ 2∘ (i.e., very close to
the middle of the Galactic plane). Since v r depends on the distance
along each line-of-sight, characterized by ℓ, this diagram contains information on
the rotation curve of the Galaxy as well as on the spatial
distribution of the gas. The maximum velocity at each ℓ is rather well defined and forms the
basis for the tangent point method. Source: P. Englmaier & O.
Gerhard 1999, Gas dynamics and
large-scale morphology of the Milky Way galaxy, MNRAS 304,
512, p. 514, Fig. 1. Reproduced by permission of Oxford
University Press on behalf of the Royal Astronomical Society

Fig. 2.29
Rotation curve of the Milky Way. Inside the
“Solar circle”, that is at R < R 0, the radial velocity is
determined quite accurately using the tangent point method; the
measurements outside have larger uncertainties. Source: D. Clemens
1985, Massachusetts-Stony Brook
Galactic plane CO survey—The Galactic disk rotation curve
ApJ 295, 422, p. 429, Fig. 3. ©AAS. Reproduced with
permission
With the tangent point method,
applied to the 21 cm line of neutral hydrogen or to radio emission
lines of molecular gas, the rotation curve of the Galaxy inside the
Solar orbit, i.e., for R < R 0, can be measured.
Rotation curve for
R > R 0 . The tangent point method cannot be
applied for R > R 0 because for
lines-of-sight at  , the radial velocity
v r attains no
maximum. In this case, the line-of-sight is nowhere parallel to a
circular orbit.
, the radial velocity
v r attains no
maximum. In this case, the line-of-sight is nowhere parallel to a
circular orbit.
, the radial velocity
v r attains no
maximum. In this case, the line-of-sight is nowhere parallel to a
circular orbit.Measuring V (R) for R > R 0 requires measuring
v r for objects
whose distance can be determined directly, e.g., Cepheids, for
which the period-luminosity relation (Sect. 2.2.7) is used, or O- and
B-stars in Hii-regions.
With ℓ and D known, R can then be calculated, and
with (2.60) we obtain Ω(R) or V (R), respectively. Any object with known
D and v r thus contributes one
data point to the Galactic rotation curve. Since the distance
estimates of individual objects are always affected by
uncertainties, the rotation curve for large values of R is less accurately known than that
inside the Solar circle. Recent measurements of blue
horizontal-branch stars within the outer halo of the Milky Way by
SDSS yielded an estimate of the rotation curve out to r ∼ 60 kpc. The situation will improve
dramatically once the results from Gaia will become available: Gaia
will measure distances via trigonometric parallaxes, and proper
motions of many star outside the Solar circle.
It turns out that the rotation curve for
R > R 0 does not decline
outwards (see Fig. 2.29) as we would expect from the distribution
of visible matter in the Milky Way. Both the stellar density and
the gas density of the Galaxy decline exponentially for large
R—e.g.,
see (2.35). This steep radial decline of the visible
matter density should imply that M(R), the mass inside R, is nearly constant for R ≳ R 0, from which a velocity
profile like  would follow, according to
Kepler’s law. However, this is not the case: V (R) is virtually constant for
R > R 0, indicating that
M(R) ∝ R. In fact, a small decrease to about
180 km∕s at R = 60 kpc was
estimated, corresponding to a total mass of (4. 0 ± 0. 7) ×
1011 M
⊙ enclosed within the inner 60 kpc, but this decrease is
much smaller than expected
from Keplerian rotation. In order to get an almost constant
rotational velocity of the Galaxy, much more matter has to be
present than we observe in gas and stars.
would follow, according to
Kepler’s law. However, this is not the case: V (R) is virtually constant for
R > R 0, indicating that
M(R) ∝ R. In fact, a small decrease to about
180 km∕s at R = 60 kpc was
estimated, corresponding to a total mass of (4. 0 ± 0. 7) ×
1011 M
⊙ enclosed within the inner 60 kpc, but this decrease is
much smaller than expected
from Keplerian rotation. In order to get an almost constant
rotational velocity of the Galaxy, much more matter has to be
present than we observe in gas and stars.The Milky Way contains, besides
stars and gas, an additional component of matter that dominates the
mass at R ≳ R 0. Its presence is known
only by its gravitational effect, since it has not been observed
directly yet, neither in emission nor in absorption. Hence, it is
called dark matter.
In Sect. 3.3.4 we will see that this is a
common phenomenon. The rotation curves of spiral galaxies are flat
up to the maximum radius at which they can be measured;
spiral galaxies contain
dark matter. A better way
of phrasing is would be to say that the visible galaxy is embedded
in a dark matter halo,
since the total mass of the Milky Way (and other spiral galaxies)
is dominated by dark matter.
2.4.3 The gravitational potential of the Galaxy
We have little direct indications about the
spatial extent of the dark matter halo, and thus its total mass,
because at large radii R
there are not many luminous objects whose orbit we can use to
measure the rotation curve out there. From the motion of satellite
galaxies, such as the Magellanic Clouds, one gets mass estimates at
larger distances, but with less accuracy. For example, the mass
inside of 100 kpc is estimated to be  from such
satellite motions. Furthermore, it is largely unknown whether this
halo is approximately spherical or deviates significantly from
sphericity, being either oblate or prolate. The stellar streams
that we discussed in Sect. 2.3.6 above can in principle be used to
constrain the axis ratio of the total matter distribution out to
large radii—if the gravitational potential of the Milky Way was
spherical, the streams would lie in a single orbital plane, so that
deviations from it can be used to probe the axis ratio of the
potential. However, currently the results from such studies are
burdened with uncertainties, and different results are obtained
from different studies.
from such
satellite motions. Furthermore, it is largely unknown whether this
halo is approximately spherical or deviates significantly from
sphericity, being either oblate or prolate. The stellar streams
that we discussed in Sect. 2.3.6 above can in principle be used to
constrain the axis ratio of the total matter distribution out to
large radii—if the gravitational potential of the Milky Way was
spherical, the streams would lie in a single orbital plane, so that
deviations from it can be used to probe the axis ratio of the
potential. However, currently the results from such studies are
burdened with uncertainties, and different results are obtained
from different studies.The nature of dark
matter is thus far unknown; in principle, we can distinguish
two totally different kinds of dark matter candidates:
-
Astrophysical dark matter, consisting of compact objects—e.g., faint stars like white dwarfs, brown dwarfs, black holes, etc. Such objects were assigned the name MACHOs, which stands for ‘MAssive Compact Halo Objects’.
-
Particle physics dark matter, consisting of elementary particles which thus far have escaped detection in laboratories.
Although the origin of astrophysical dark matter
would be difficult to understand (not least because of the baryon
abundance in the Universe—see Sect. 4.4.5—and because of the metal
abundance in the ISM), a direct distinction between the two
alternatives through observation would be of great interest. In the
following section we will describe a method which is able to probe
whether the dark matter in our Galaxy consists of MACHOs.
2.5 The Galactic microlensing effect: The quest for compact dark matter
In 1986, Bohdan Paczyński proposed to test the
possible presence of MACHOs by performing microlensing experiments.
As we will soon see, this was a daring idea at that time, but since
then such experiments have been carried out. In this section we
will mainly summarize and discuss the results of these searches for
MACHOs. We will start with a description of the microlensing effect
and then proceed with its specific application to the search for
MACHOs.
2.5.1 The gravitational lensing effect I
Einstein’s
deflection angle. Light,
just like massive particles, is deflected in a gravitational
field. This is one of the specific predictions by Einstein’s
theory of gravity, General Relativity. Quantitatively it predicts
that a light beam which passes a point mass M at a distance ξ is deflected by an angle  , which amounts to
 The deflection law (2.74) is valid as long as
  , which is the case for weak
gravitational fields. If we now set
, which is the case for weak
gravitational fields. If we now set  ,
,  in the foregoing equation, we
obtain
in the foregoing equation, we
obtain
 for the light deflection at the limb of the Sun. This deflection of
light was measured during a Solar eclipse in 1919 from the shift of
the apparent positions of stars close to the shaded Solar disk. Its
agreement with the value predicted by Einstein made him
world-famous over night, because this was the first real and
challenging test of General Relativity. Although the precision of
the measured value back then was only ∼ 30 %, it was sufficient to confirm
Einstein’s theory. By now the law (2.74) has been measured
in the Solar System with a relative precision of about 5 ×
10−4, and Einstein’s prediction has been
confirmed.
for the light deflection at the limb of the Sun. This deflection of
light was measured during a Solar eclipse in 1919 from the shift of
the apparent positions of stars close to the shaded Solar disk. Its
agreement with the value predicted by Einstein made him
world-famous over night, because this was the first real and
challenging test of General Relativity. Although the precision of
the measured value back then was only ∼ 30 %, it was sufficient to confirm
Einstein’s theory. By now the law (2.74) has been measured
in the Solar System with a relative precision of about 5 ×
10−4, and Einstein’s prediction has been
confirmed.
, which amounts to
(2.74)
, which is the case for weak
gravitational fields. If we now set , in the foregoing equation, we
obtain
Not long after the discovery of gravitational
light deflection at the Sun, the following scenario was considered.
If the deflection was sufficiently strong, light from a very
distant source could be visible at two positions in the sky: one
light ray could pass a mass concentration, located between us and
the source, ‘to the right’, and the second one ‘to the left’, as
sketched in Fig. 2.30. The astrophysical consequence of this
gravitational light deflection is also called the gravitational lens effect. We will
discuss various aspects of the lens effect in the course of this
book, and we will review its astrophysical applications.

Fig. 2.30
Sketch of a gravitational lens system. If a
sufficiently massive mass concentration is located between us and a
distant source, it may happen that we observe this source at two
different positions on the sphere. Source: J. Wambsganss 1998,
Gravitational Lensing in
Astronomy, Living Review in Relativity 1, 12, Fig. 2. ©Max
Planck Society and the author; Living Reviews in Relativity,
published by the Max Planck Institute for Gravitational Physics
(Albert Einstein Institute), Germany
The Sun is not able to cause multiple images of
distant sources. The maximum deflection angle  is much smaller than the
angular radius of the Sun, so that two beams of light that pass the
Sun to the left and to the right cannot converge by light
deflection at the position of the Earth. Given its radius, the Sun
is too close to produce multiple images, since its angular radius
is (far) larger than the deflection angle
is much smaller than the
angular radius of the Sun, so that two beams of light that pass the
Sun to the left and to the right cannot converge by light
deflection at the position of the Earth. Given its radius, the Sun
is too close to produce multiple images, since its angular radius
is (far) larger than the deflection angle  . However, the light
deflection by more distant stars (or other massive celestial
bodies) can produce multiple images of sources located behind
them.
. However, the light
deflection by more distant stars (or other massive celestial
bodies) can produce multiple images of sources located behind
them.
is much smaller than the
angular radius of the Sun, so that two beams of light that pass the
Sun to the left and to the right cannot converge by light
deflection at the position of the Earth. Given its radius, the Sun
is too close to produce multiple images, since its angular radius
is (far) larger than the deflection angle . However, the light
deflection by more distant stars (or other massive celestial
bodies) can produce multiple images of sources located behind
them.
Fig. 2.31
Geometry of a gravitational lens system.
Consider a source to be located at a distance D s from us and a mass
concentration at distance D
d. An optical axis is defined that connects the observer
and the center of the mass concentration; its extension will
intersect the so-called source plane, a plane perpendicular to the
optical axis at the distance of the source. Accordingly, the lens
plane is the plane perpendicular to the line-of-sight to the mass
concentration at distance D
d from us. The intersections of the optical axis and the
planes are chosen as the origins of the respective coordinate
systems. Let the source be at the location  in the source plane; a light
beam that encloses an angle
in the source plane; a light
beam that encloses an angle  to the optical axis
intersects the lens plane at the point
to the optical axis
intersects the lens plane at the point  and is deflected by an angle
 .
All these quantities are two-dimensional vectors. The condition
that the source is observed in the direction
.
All these quantities are two-dimensional vectors. The condition
that the source is observed in the direction  is given by the lens
equation (2.77) which follows from the theorem of
intersecting lines. Adapted from: P. Schneider, J. Ehlers &
E.E. Falco 1992, Gravitational
Lenses, Springer-Verlag
is given by the lens
equation (2.77) which follows from the theorem of
intersecting lines. Adapted from: P. Schneider, J. Ehlers &
E.E. Falco 1992, Gravitational
Lenses, Springer-Verlag
in the source plane; a light
beam that encloses an angle to the optical axis
intersects the lens plane at the point and is deflected by an angle
.
All these quantities are two-dimensional vectors. The condition
that the source is observed in the direction is given by the lens
equation (2.77) which follows from the theorem of
intersecting lines. Adapted from: P. Schneider, J. Ehlers &
E.E. Falco 1992, Gravitational
Lenses, Springer-VerlagLens
geometry. The geometry of a gravitational lens system is
depicted in Fig. 2.31. We consider light rays from a source at
distance D s
from us that pass a mass concentration (called a lens or deflector)
at a separation  . The deflector is at a distance
D d from us. In
Fig. 2.31
. The deflector is at a distance
D d from us. In
Fig. 2.31
 denotes the true,
two-dimensional position of the source in the source plane, and
denotes the true,
two-dimensional position of the source in the source plane, and
 is the true angular position
of the source, that is the angular position at which it would be
observed in the absence of light deflection,
is the true angular position
of the source, that is the angular position at which it would be
observed in the absence of light deflection,
 The position of the light ray in the lens plane is denoted by
 , and
, and  is the corresponding angular
position,
is the corresponding angular
position,
 Hence,
  is the observed position of
the source on the sphere relative to the position of the ‘center of
the lens’ which we have chosen as the origin of the coordinate
system,
is the observed position of
the source on the sphere relative to the position of the ‘center of
the lens’ which we have chosen as the origin of the coordinate
system,  . Like the position vectors
 and
and  , the angles
  and
and  are two-dimensional vectors,
corresponding to the two directions on the sky. D ds is the distance of the
source plane from the lens plane. As long as the relevant distances
are much smaller than the ‘radius of the Universe’ c∕H 0, which is certainly the
case within our Galaxy and in the Local Group, we have
are two-dimensional vectors,
corresponding to the two directions on the sky. D ds is the distance of the
source plane from the lens plane. As long as the relevant distances
are much smaller than the ‘radius of the Universe’ c∕H 0, which is certainly the
case within our Galaxy and in the Local Group, we have  .
However, this relation is no longer valid for cosmologically
distant sources and lenses; we will come back to this issue in
Sect. 4.3.3.
.
However, this relation is no longer valid for cosmologically
distant sources and lenses; we will come back to this issue in
Sect. 4.3.3.
. The deflector is at a distance
D d from us. In
Fig. 2.31
denotes the true,
two-dimensional position of the source in the source plane, and
is the true angular position
of the source, that is the angular position at which it would be
observed in the absence of light deflection,
(2.75)
, and is the corresponding angular
position,
(2.76)
is the observed position of
the source on the sphere relative to the position of the ‘center of
the lens’ which we have chosen as the origin of the coordinate
system, . Like the position vectors
and , the angles and are two-dimensional vectors,
corresponding to the two directions on the sky. D ds is the distance of the
source plane from the lens plane. As long as the relevant distances
are much smaller than the ‘radius of the Universe’ c∕H 0, which is certainly the
case within our Galaxy and in the Local Group, we have .
However, this relation is no longer valid for cosmologically
distant sources and lenses; we will come back to this issue in
Sect. 4.3.3.Lens
equation. From Fig. 2.31 we can deduce the condition that a light
ray from the source will reach us from the direction  (or
(or  ),
),
 or, after dividing by D
s and using (2.75) and (2.76):
or, after dividing by D
s and using (2.75) and (2.76):
 Due to the factor multiplying the deflection angle
in (2.78), it is convenient to define the
reduced deflection angle
Due to the factor multiplying the deflection angle
in (2.78), it is convenient to define the
reduced deflection angle

(or ),
(2.77)
(2.78)
(2.79)
so that the lens equation (2.78) attains the simple
form

(2.80)
Multiple
images of a source occur if the lens
equation (2.80) has multiple solutions  for a (true) source
position
for a (true) source
position  —in this case, the source is
observed at the positions
—in this case, the source is
observed at the positions  on the sphere.
for a (true) source
position —in this case, the source is
observed at the positions on the sphere.The deflection angle  depends on the mass distribution of the deflector. We will discuss
the deflection angle for an arbitrary density distribution of a
lens in Sect. 3.11. Here we will first concentrate
on point masses, which is—in most cases—a good approximation for
the lensing effect by stars.
depends on the mass distribution of the deflector. We will discuss
the deflection angle for an arbitrary density distribution of a
lens in Sect. 3.11. Here we will first concentrate
on point masses, which is—in most cases—a good approximation for
the lensing effect by stars.
depends on the mass distribution of the deflector. We will discuss
the deflection angle for an arbitrary density distribution of a
lens in Sect. 3.11. Here we will first concentrate
on point masses, which is—in most cases—a good approximation for
the lensing effect by stars.
or, if we account for the direction of the
deflection (the deflection angle always points towards the point
mass),

(2.81)
Explicit solution
of the lens equation for a point mass. The lens equation for
a point mass is simple enough to be solved analytically which means
that for each source position  the respective image positions
 can be determined.
In (2.81), the left-hand side is an angle, whereas
can be determined.
In (2.81), the left-hand side is an angle, whereas
 is an inverse of an angle. Hence, the prefactor of this term must
be the square of an angle, which is called the Einstein angle of the lens,
is an inverse of an angle. Hence, the prefactor of this term must
be the square of an angle, which is called the Einstein angle of the lens,
 thus the lens equation (2.80) for the point-mass lens with a deflection
angle (2.81) can be written as
thus the lens equation (2.80) for the point-mass lens with a deflection
angle (2.81) can be written as
 Obviously, θ E
is a characteristic angle in this equation, so that for practical
reasons we will use the scaling
Obviously, θ E
is a characteristic angle in this equation, so that for practical
reasons we will use the scaling
 and the lens equation simplifies to
 After multiplication with
  , this becomes a quadratic equation,
whose solutions are
, this becomes a quadratic equation,
whose solutions are
 From this solution of the lens equation one can immediately draw a
number of conclusions:
From this solution of the lens equation one can immediately draw a
number of conclusions:
the respective image positions
can be determined.
In (2.81), the left-hand side is an angle, whereas
is an inverse of an angle. Hence, the prefactor of this term must
be the square of an angle, which is called the Einstein angle of the lens,
(2.82)
(2.83)
, this becomes a quadratic equation,
whose solutions are
(2.84)
-
For each source position
 , the lens
equation for a point-mass lens has two solutions—any source is
(formally, at least) imaged twice. The reason for this is the
divergence of the deflection angle for θ → 0. This divergence does not occur
in reality because of the finite geometric extent of the lens
(e.g., the radius of the star), as the solutions are of course
physically relevant only if
, the lens
equation for a point-mass lens has two solutions—any source is
(formally, at least) imaged twice. The reason for this is the
divergence of the deflection angle for θ → 0. This divergence does not occur
in reality because of the finite geometric extent of the lens
(e.g., the radius of the star), as the solutions are of course
physically relevant only if  is larger than the radius of the star. We need to point out again
that we explicitly exclude the case of strong gravitational fields
such as the light deflection near a black hole or a neutron star,
for which the equation for the deflection angle has to be modified,
since there the gravitational field is no longer weak.
is larger than the radius of the star. We need to point out again
that we explicitly exclude the case of strong gravitational fields
such as the light deflection near a black hole or a neutron star,
for which the equation for the deflection angle has to be modified,
since there the gravitational field is no longer weak. -
The two images
 are collinear with the lens and
the source. In other words, the observer, lens, and source define a
plane, and light rays from the source that reach the observer are
located in this plane as well. One of the two images is located on
the same side of the lens as the source (
are collinear with the lens and
the source. In other words, the observer, lens, and source define a
plane, and light rays from the source that reach the observer are
located in this plane as well. One of the two images is located on
the same side of the lens as the source ( ), the
second image is located on the other side—as is already indicated
in Fig. 2.30.
), the
second image is located on the other side—as is already indicated
in Fig. 2.30. -
If
 , so that the source is
positioned exactly behind the lens, the full circle
, so that the source is
positioned exactly behind the lens, the full circle  , or
, or
 ,
is a solution of the lens equation (2.83)—the source is seen
as a circular image. In this case, the source, lens, and observer
no longer define a plane, and the problem becomes axially
symmetric. Such a circular image is called an Einstein ring. Ring-shaped images have
indeed been observed, as we will discuss in Sect. 3.11.3
,
is a solution of the lens equation (2.83)—the source is seen
as a circular image. In this case, the source, lens, and observer
no longer define a plane, and the problem becomes axially
symmetric. Such a circular image is called an Einstein ring. Ring-shaped images have
indeed been observed, as we will discuss in Sect. 3.11.3 -
The angular diameter of this ring is then 2θ E. From the solution (2.84), one can easily see that the separation between the two images is about
 (as long as
  ),
hence
the Einstein angle thus specifies the characteristic image separation. Situations with
),
hence
the Einstein angle thus specifies the characteristic image separation. Situations with
 , and
hence angular separations significantly larger than 2θ E, are astrophysically of
only minor relevance, as will be shownbelow.
, and
hence angular separations significantly larger than 2θ E, are astrophysically of
only minor relevance, as will be shownbelow.
Magnification—the
principle. Light beams are not only deflected as a whole,
but they are also subject to differential deflection. For instance,
those rays of a light beam (also called light bundle) that are
closer to the lens are deflected more than rays at the other side
of the beam. The differential deflection is an effect of the tidal
component of the deflection angle; this is sketched in
Fig. 2.32.

Fig. 2.32
Light beams are deflected differentially,
leading to changes of the shape and the cross-sectional area of the
beam. As a consequence, the observed solid angle subtended by the
source, as seen by the observer, is modified by gravitational light
deflection. In the example shown, the observed solid angle
 is
larger than the one subtended by the undeflected source,
is
larger than the one subtended by the undeflected source,
 —the
image of the source is thus magnified. Source: P. Schneider, J.
Ehlers & E.E. Falco 1992, Gravitational Lenses,
Springer-Verlag
—the
image of the source is thus magnified. Source: P. Schneider, J.
Ehlers & E.E. Falco 1992, Gravitational Lenses,
Springer-Verlag
is
larger than the one subtended by the undeflected source,
—the
image of the source is thus magnified. Source: P. Schneider, J.
Ehlers & E.E. Falco 1992, Gravitational Lenses,
Springer-VerlagBy differential deflection, the solid angle which
the image of the source subtends on the sky changes. Let
ω s be the solid
angle the source would subtend if no lens was present, and
ω the observed solid angle
of the image of the source in the presence of a deflector. Since
gravitational light deflection is not linked to emission or
absorption of radiation, the surface brightness (or specific
intensity) is preserved. The flux of a source is given as the
product of surface brightness and solid angle. Since the former of
the two factors is unchanged by light deflection, but the solid
angle changes, the observed flux of the source is modified. If
S 0 is the flux
of the unlensed source and S the flux of an image of the source,
then
 describes the change in flux that is caused by a magnification (or
a diminution) of the image of a source. Obviously, the
magnification is a purely geometrical effect.
describes the change in flux that is caused by a magnification (or
a diminution) of the image of a source. Obviously, the
magnification is a purely geometrical effect.
(2.85)
Magnification for
‘small’ sources. For sources and images that are much
smaller than the characteristic scale of the lens, the
magnification μ is given by
the differential area distortion of the lens
mapping (2.80),

(2.86)
Hence for small sources, the ratio of solid
angles of the lensed image and the unlensed source is described by
the determinant of the local Jacobi matrix.14
The magnification can therefore be calculated for
each individual image of the source, and the total magnification of
a source, given by the ratio of the sum of the fluxes of the
individual images and the flux of the unlensed source, is the sum
of the magnifications for the individual images.
Magnification for
the point-mass lens. For a point-mass lens, the
magnifications for the two images (2.84) are

(2.87)
From this it follows that for the ‘+’-image
μ + > 1 for
all source positions  ,
whereas the ‘−’-image can have magnification either larger or less
than unity, depending on y.
The magnification of the two images is illustrated in
Fig. 2.33,
while Fig. 2.34 shows the magnification for several
different source positions y. For y ≫ 1, one has μ + ≳ 1 and μ − ∼ 0, from which we draw
the following conclusion: if the source and lens are not
sufficiently well aligned, the secondary image is strongly
demagnified and the primary image has magnification very close to
unity. For this reason, situations with y ≫ 1 are of little relevance since
then essentially only one image is observed which has about the
same flux as the unlensed source.
,
whereas the ‘−’-image can have magnification either larger or less
than unity, depending on y.
The magnification of the two images is illustrated in
Fig. 2.33,
while Fig. 2.34 shows the magnification for several
different source positions y. For y ≫ 1, one has μ + ≳ 1 and μ − ∼ 0, from which we draw
the following conclusion: if the source and lens are not
sufficiently well aligned, the secondary image is strongly
demagnified and the primary image has magnification very close to
unity. For this reason, situations with y ≫ 1 are of little relevance since
then essentially only one image is observed which has about the
same flux as the unlensed source.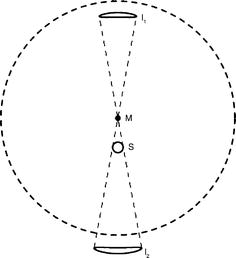
Fig. 2.33
Illustration of the lens mapping by a point
mass M. The unlensed source S and the two images I1 and
I2 of the lensed source are shown. We see that the two
images have a solid angle different from the unlensed source, and
they also have a different shape. The dashed circle shows the Einstein radius
of the lens. Source: B. Paczyński 1996, Gravitational Microlensing in the Local
Group ARA&A 34, 419, p. 424. Reprinted, with
permission, from the Annual Review
of Astronomy & Astrophysics, Volume 34 ©1996 by Annual
Reviews www.annualreviews.org
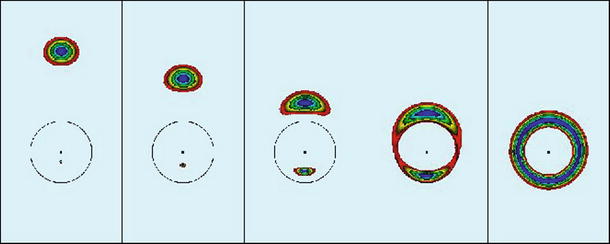
Fig. 2.34
Image of a circular source with a radial
brightness profile—indicated by colors—for different relative
positions of the lens and source. y decreases from left to right; in the rightmost figure
y = 0 and an Einstein ring
is formed. Source: J. Wambsganss 1998, Gravitational Lensing in Astronomy,
Living Review in Relativity 1, 12, Fig. 20. ©Max Planck Society and
the author; Living Reviews in Relativity, published by the Max
Planck Institute for Gravitational Physics (Albert Einstein
Institute), Germany
For y → 0, the two magnifications diverge,
μ
± → ∞. The
reason for this is purely geometric: in this case, out of a
0-dimensional point source a one-dimensional image, the Einstein
ring, is formed. This divergence is not physical, of course, since
infinite magnifications do not occur in reality. The magnifications
remain finite even for y = 0, for two reasons. First, real
sources have a finite extent, and for these the magnification is
finite. Second, even if one had a point source, wave effects of the
light (interference) would lead to a finite value of μ. The total magnification of a point
source by a point-mass lens follows from the sum of the
magnifications (2.87),

(2.88)
2.5.2 Galactic microlensing effect
After these theoretical considerations we will
now return to the starting point of our discussion, employing the
lensing effect as a potential diagnostic for dark matter in our
Milky Way, if this dark matter were to consist of compact mass
concentrations, e.g., very faint stars.
Image
splitting. Considering a star in our Galaxy as the
lens, (2.82) yields the Einstein angle
 Since the angular separation Δ
θ of the two images is about 2θ E, the typical image
splittings are about a milliarcsecond (mas) for lens systems
including Galactic stars; such angular separations are as yet not
observable with optical telescopes. This insight made Einstein
believe in 1936, after he conducted a detailed quantitative
analysis of gravitational lensing by point masses, that the lens
effect will not be observable.15
Since the angular separation Δ
θ of the two images is about 2θ E, the typical image
splittings are about a milliarcsecond (mas) for lens systems
including Galactic stars; such angular separations are as yet not
observable with optical telescopes. This insight made Einstein
believe in 1936, after he conducted a detailed quantitative
analysis of gravitational lensing by point masses, that the lens
effect will not be observable.15
(2.89)
Magnification. Bohdan Paczyński pointed
out in 1986 that, although image splitting was unobservable, the
magnification by the lens should nevertheless be measurable. To do
this, we have to realize that the absolute magnification is
observable only if the unlensed flux of the source is known—which
is not the case, of course (for nearly all sources). However, the
magnification, and therefore also the observed flux, changes with
time by the relative motion of source, lens, and ourselves.
Therefore, the flux is a function of time, caused by the
time-dependent magnification.
Characteristic
time-scale of the variation. Let v be a typical transverse velocity of
the lens, then its angular velocity (or proper motion) is
 if we consider the source and the observer to be at rest. The
characteristic time-scale of the variability is then given by
if we consider the source and the observer to be at rest. The
characteristic time-scale of the variability is then given by
 This time-scale is of the order of a month for lenses with
M ∼ M ⊙ and typical Galactic
velocities. In the general case that source, lens, and observer are
all moving, v has to be
considered as an effective velocity. Alternatively, the motion of
the source in the source plane can be considered.
This time-scale is of the order of a month for lenses with
M ∼ M ⊙ and typical Galactic
velocities. In the general case that source, lens, and observer are
all moving, v has to be
considered as an effective velocity. Alternatively, the motion of
the source in the source plane can be considered.
(2.90)
(2.91)
The fact that t E comes out to be a month
for characteristic values of distances and velocities in our Galaxy
is a fortunate coincidence, since it implies that these variations
are in fact observable. If the time-scale was a factor ten times
larger, the characteristic light curve would extend over several
observing periods and include the annual gaps where the sources are
not visible, making the detection of events much more difficult. If
t E was of order
several years, the variability time-scale would be longer than the
life-time of most projects in astrophysics. Conversely, it
t E was
considerable shorter than a day, the variations would be difficult
to record.
Light
curves. In most cases, the relative motion can be considered
linear, so that the position of the source in the source plane can
be written as
 Using the scaled position
  ,
for
,
for  we
obtain
we
obtain

,
for we
obtain
(2.92)
where p = y min specifies the minimum
distance from the optical axis, and t max is the time at which
y = p attains this minimum value, thus when
the magnification  is maximized.
From this, and using (2.88), one obtains the light curve
is maximized.
From this, and using (2.88), one obtains the light curve

is maximized.
From this, and using (2.88), one obtains the light curve
(2.93)

Fig. 2.35
Illustration of a Galactic microlensing
event: In the upper panel a
source (depicted by the open circles) moves behind a point-mass
lens; for each source position two images of the source are formed,
which are indicated by the black ellipses. Note that
Fig. 2.33
shows the imaging properties for one of the source positions shown
here. The identification of the corresponding image pair with the
source position follows from the fact that, in projection, the
source, the lens, and the two images are located on a straight line, which is indicated for
one source position; this property follows from the collinearity of
source and images mentioned in the text. The dashed circle represents the Einstein
ring. In the middle panel,
different trajectories of the source are shown, each characterized
by the smallest projected separation p to the lens. The light curves
resulting from these relative motions, which can be calculated
using (2.93),
are then shown in the bottom
panel for different values of p. The smaller p is, the larger the maximum
magnification will be, here measured in magnitudes. Source: B.
Paczyński 1996, Gravitational
Microlensing in the Local Group ARA&A 34, 419,
p. 425, 426, 427. Reprinted, with permission, from the
Annual Review of Astronomy &
Astrophysics, Volume 34 ©1996 by Annual Reviews www.annualreviews.org
Examples for such light curves are shown in
Fig. 2.35.
They depend on only four parameters: the flux of the unlensed
source S 0, the
time of maximum magnification t max, the smallest distance
of the source from the optical axis p, and the characteristic time scale
t E. All these
values are directly observable in a light curve. One obtains
t max from the
time of the maximum of the light curve, S 0 is the flux that is
measured for very large and small times, S 0 = S(t → ±∞), or S 0 ≈ S(t) for  .
Furthermore, p follows from
the maximum magnification
.
Furthermore, p follows from
the maximum magnification  by
inversion of (2.88), and t E from the width of the
light curve.
by
inversion of (2.88), and t E from the width of the
light curve.
.
Furthermore, p follows from
the maximum magnification by
inversion of (2.88), and t E from the width of the
light curve.Only t
E contains information of astrophysical relevance,
because the time of the maximum, the unlensed flux of the source,
and the minimum separation p provide no information about the
lens. Since  ,
this time scale contains the combined information on the lens mass,
the distances to the lens and the source, and the transverse
velocity: Only the
combination
,
this time scale contains the combined information on the lens mass,
the distances to the lens and the source, and the transverse
velocity: Only the
combination  can be derived from the light
curve, but not mass, distance, or velocity
individually.
can be derived from the light
curve, but not mass, distance, or velocity
individually.
,
this time scale contains the combined information on the lens mass,
the distances to the lens and the source, and the transverse
velocity: Only the
combination
can be derived from the light
curve, but not mass, distance, or velocity
individually.Paczyński’s idea can be expressed as follows: if
the halo of our Milky Way consists (partially) of compact objects,
a distant compact source should, from time to time, be lensed by
one of these MACHOs and thus show characteristic changes in flux,
corresponding to a light curve similar to those in
Fig. 2.35.
The number density of MACHOs is proportional to the probability or
abundance of lensing events, and the characteristic mass of the
MACHOs is proportional to the square of the typical variation time
scale t E. All
one has to do is measure the light curves of a sufficiently large
number of background sources and extract all lens events from those
light curves to obtain information on the population of potential
MACHOs in the halo. A given halo model predicts the spatial density
distribution and the distribution of velocities of the MACHOs and
can therefore be compared to the observations in a statistical way.
However, one faces the problem that the abundance of such lensing
events is very small.
Probability of a
lensing event. In practice, a system of a foreground lens
and a background source is considered a lensing event if
p ≤ 1, or β min ≤ θ E, and hence  ,
i.e., if the relative trajectory of the source passes within the
Einstein circle of the lens.
,
i.e., if the relative trajectory of the source passes within the
Einstein circle of the lens.
,
i.e., if the relative trajectory of the source passes within the
Einstein circle of the lens.If the dark halo of the Milky Way consisted
solely of MACHOs, the probability that a very distant source is
lensed (in the sense of  )
would be ∼ 10−7, where the exact value depends on the
direction to the source. At any one time, one of ∼ 107
distant sources would be located within the Einstein radius of a
MACHO in our halo. The immediate consequence of this is that the
light curves of millions of sources have to be monitored to detect
this effect. Furthermore, these sources have to be located within a
relatively small region on the sphere to keep the total solid angle
that has to be photometrically monitored relatively small. This
condition is needed to limit the required observing time, so that
many such sources should be present within the field-of-view of the
camera used. The stars of the Magellanic Clouds are well suited for
such an experiment: they are close together on the sphere, but can
still be resolved into individual stars.
)
would be ∼ 10−7, where the exact value depends on the
direction to the source. At any one time, one of ∼ 107
distant sources would be located within the Einstein radius of a
MACHO in our halo. The immediate consequence of this is that the
light curves of millions of sources have to be monitored to detect
this effect. Furthermore, these sources have to be located within a
relatively small region on the sphere to keep the total solid angle
that has to be photometrically monitored relatively small. This
condition is needed to limit the required observing time, so that
many such sources should be present within the field-of-view of the
camera used. The stars of the Magellanic Clouds are well suited for
such an experiment: they are close together on the sphere, but can
still be resolved into individual stars.Problems, and
their solution. From this observational strategy, a large
number of problems arise immediately; they were discussed in
Paczyński’s original paper. First, the photometry of so many
sources over many epochs produces a huge amount of data that need
to be handled; they have to be stored and reduced. Second, one has
the problem of ‘crowding’: the stars in the Magellanic Clouds are
densely packed on the sky, which renders the photometry of
individual stars difficult. Third, stars also show intrinsic
variability—about 1 % of all stars are variable. This intrinsic
variability has to be distinguished from that due to the lens
effect. Due to the small probability of the latter, selecting the
lensing events is comparable to searching for a needle in a
haystack. Finally, it should be mentioned that one has to ensure
that the experiment is indeed sensitive enough to detect lensing
events. A ‘calibration experiment’ would therefore be
desirable.
Faced with these problems, it seemed daring to
seriously think about the realization of such an observing program.
However, a fortunate event helped, in the magnificent time of the
easing of tension between the US and the Soviet Union, and their
respective allies, at the end of the 1980s. Physicists and
astrophysicists, that had been partly occupied with issues
concerning national security, then saw an opportunity to meet new
challenges. In addition, scientists in national laboratories had
much better access to sufficient computing power and storage
capacity than those in other research institutes, attenuating some
of the aforementioned problems. While the expected data volume was
still a major problem in 1986, it could be handled a few years
later. Also, wide-field cameras were constructed, with which large
areas of the sky could be observed simultaneously. Software was
developed specialized to the photometry of objects in crowded
fields, so that light curves could be measured even if individual
stars in the image were no longer cleanly separated.
To distinguish between lensing events and
intrinsic variability of stars, we note that the microlensing light
curves have a characteristic shape that is described by only four
parameters. The light curves should be symmetric and achromatic
because gravitational light deflection is independent of the
frequency of the radiation. Furthermore, due to the small lensing
probability, any source should experience at most one microlensing
event and show a constant flux before and after, whereas intrinsic
variations of stars are often periodic and in nearly all cases
chromatic.
And finally a control experiment could be
performed: the lensing probability in the direction of the Galactic
bulge is known, or at least, we can obtain a lower limit for it
from the observed density of stars in the disk. If a microlens
experiment is carried out in the direction of the Galactic bulge,
we have to find lensing
events if the experiment is sufficiently sensitive.
2.5.3 Surveys and results
In the early 1990s, two collaborations (MACHO and
EROS) began the search for microlensing events towards the
Magellanic Clouds. Another group (OGLE) started searching in an
area of the Galactic bulge. Fields in the respective survey regions
were observed regularly, typically once every night if weather
conditions permitted. From the photometry of the stars in the
fields, light curves for many millions of stars were generated and
then checked for microlensing events.
First
detections. In 1993, all three groups reported their first
results. The MACHO collaboration found one event in the Large
Magellanic Cloud (LMC), the EROS group two events, and the OGLE
group observed one event in the Galactic bulge. The light curve of
the first MACHO event is plotted in Fig. 2.36. It was observed in
two different filters, and the fit to the data, which corresponds
to a standard light curve (2.93), is the same for both filters, proving
that the event is achromatic. Together with the quality of the fit
to the data, this is very strong evidence for the microlensing
nature of the event.
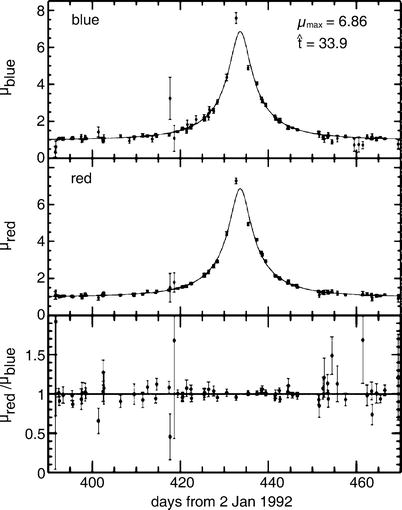
Fig. 2.36
Light curve of the first observed
microlensing event in the LMC, in two broad-band filters. The
solid curve is the
best-fitting microlensing light curve as described
by (2.93), with μ max = 6. 86. The ratio of
the magnifications in both filters is displayed at the bottom, and
it is compatible with 1. Some of the data points deviate
significantly from the curve; this means that either the errors in
the measurements were underestimated, or this event is more
complicated than one described by a point-mass lens—see
Sect. 2.5.4.
Source: C. Alcock et al. 1993, Possible gravitational microlensing of a star
in the Large Magellanic Cloud, Nature 365, 621

Fig. 2.37
In this 8∘× 8∘ image
of the LMC, 30 fields are marked in red which the MACHO group has searched
for microlensing events during the ∼ 5. 5 yr of their experiment;
images were taken in two filters to test for achromaticity. The
positions of 17 microlensing events are marked by yellow circles; these have been subject
to statistical analysis. Source: C. Alcock et al. 2000,
The MACHO Project: Microlensing
Results from 5.7 Years of Large Magellanic Cloud
Observations, ApJ 542, 281, p. 284, Fig. 1. ©AAS.
Reproduced with permission
Statistical
results. After 1993, all three aforementioned teams
proceeded with their observations and analysis (Fig. 2.37), and more groups
have begun the search for microlensing events, choosing various
lines of sight. The most important results from these experiments
can be summarized as follows:
About 20 events have been found in the direction
of the Magellanic Clouds, and some ten thousand in the direction of
the bulge. The statistical analysis of the data revealed the
lensing probability towards the bulge to be higher than originally
expected. This can be explained by the fact that our Galaxy features a bar (see
Chap. 3). This bar was also observed in IR
maps such as those made by the COBE satellite. The events in the
direction of the bulge are dominated by lenses that are part of the
bulge themselves, and their column density is increased by the
bar-like shape of the bulge. On the other hand, the lensing
probability in the direction of the Magellanic Clouds is much
smaller than expected for
the case where the dark halo consists solely of MACHOs. Based on
the analysis of the MACHO collaboration, the observed statistics of
lensing events towards the Magellanic Clouds is best explained if
about 20 % of the halo mass consists of MACHOs, with a
characteristic mass of about M ∼ 0. 5M ⊙ (see Fig. 2.38).

Fig. 2.38
Probability contours for a specific halo
model as a function of the characteristic MACHO mass M (here denoted by m) and the mass fraction f of MACHOs in the halo. The halo of
the LMC was either taken into account as an additional source for
microlenses (lmc halo) or not (no lmc halo), and two different
selection criteria (A, B) for the statistically complete
microlensing sample were employed. In all cases, M ∼ 0. 5M ⊙ and f ∼ 0. 2 are the best-fit values.
Source: C. Alcock et al. 2000, The
MACHO Project: Microlensing Results from 5.7 Years of Large
Magellanic Cloud Observations, ApJ 542, 281, p. 304,
Fig. 12. ©AAS. Reproduced with permission
Interpretation and
discussion. This latter result is not easy to interpret and
came as a real surprise. If a result compatible
with ∼ 100 % had been
found, it would have been obvious to conclude that the dark matter
in our Milky Way consists of compact objects. Otherwise, if very
few lensing events had been found, it would have been clear that
MACHOs do not contribute significantly to the dark matter. But a
value of 20 % does not immediately allow any unambiguous
interpretation. Taken at face value, the result from the MACHO
group would imply that the total mass of MACHOs in the Milky Way
halo is about the same as that in the stellar disk.
Furthermore, the estimated mass scale is hard to
understand: what could be the nature of MACHOs with M = 0. 5M ⊙? Normal stars can be
excluded, because they would be far too luminous to escape direct
observations. White dwarfs are also unsuitable candidates, because
to produce such a large number of white dwarfs as a final stage of
stellar evolution, the total star formation in our Milky Way,
integrated over its lifetime, needs to be significantly larger than
normally assumed. In this case, many more massive stars would also
have formed, which would then have released the metals they
produced into the ISM, both by stellar winds and in supernova
explosions. In such a scenario, the metal content of the ISM would
therefore be distinctly higher than is actually observed. The only
possibility of escaping this argument is with the hypothesis that
the mass function of newly formed stars (the initial mass function,
IMF) was different in the early phase of the Milky Way compared to
that observed today. The IMF that needs to be assumed in this case
is such that for each star of intermediate mass which evolves into
a white dwarf, far fewer high-mass stars, mainly responsible for
the metal enrichment of the ISM, must have formed in the past
compared to today. However, we lack a plausible physical model for
such a scenario, and it is in conflict with the star-formation
history that we observe in the high-redshift Universe (see
Chap. 9).
Neutron stars can be excluded as well, because
they are too massive (typically > 1M ⊙); in addition, they are
formed in supernova explosions, implying that the aforementioned
metallicity problem would be even greater for neutron stars. Would
stellar-mass black holes be an alternative? The answer to this
question depends on how they are formed. They could not originate
in SN explosions, again because of the metallicity problem. If they
had formed in a very early phase of the Universe (they are then
called primordial black holes), this would be an imaginable, though
perhaps quite exotic, alternative.
However, we have strong indications that the
interpretation of the MACHO results is not as straightforward as
described above. Some doubts have been raised as to whether all
events reported as being due to microlensing are in fact caused by
this effect. In fact, one of the microlensing source stars
identified by the MACHO group showed another bump 7 years after the
first event. Given the extremely small likelihood of two
microlensing events happening to a single source this is almost
certainly a star with unusual variability. There are good arguments
to attribute two events to stars in the thick disk.

Fig. 2.39
From observations by the EROS
collaboration, a large mass range for MACHO candidates can be
excluded. The maximum allowed fraction of the halo mass contained
in MACHOs is plotted as a function of the MACHO mass M, as an upper limit with 95 %
confidence. A standard model for the mass distribution in the
Galactic halo was assumed which describes the rotation curve of the
Milky Way quite well. The various
curves show different phases of the EROS experiment. They
are plotted separately for observations in the directions of the
LMC and the SMC. The experiment EROS 1 searched for microlensing
events on short time-scales but did not find any; this yields the
upper limits at small masses. Upper limits at larger masses were
obtained by the EROS 2 experiment. The thick solid curve represents the upper
limit derived from combining the individual experiments. If not a
single MACHO event had been found the upper limit would have been
described by the dotted line. Source: C. Afonso et al. 2003,
Limits on Galactic dark matter
with 5 years of EROS SMC data, A&A 400, 951,
p. 955, Fig. 3. ©ESO. Reproduced with permission
As argued previously, by means of t E we only measure a
combination of lens mass, transverse velocity, and distance. The
result given in Fig. 2.38 is therefore based on the statistical
analysis of the lensing events in the framework of a halo model
that describes the shape and the radial density profile of the
halo. However, microlensing events have been observed for which
more than just t
E can be determined—e.g., events in which the lens is a
binary star, or those for which t E is larger than a few
months. In this case, the orbit of the Earth around the Sun, which
is not a linear motion, has a noticeable effect, causing deviations
from the standard light curve. Such parallax events have indeed
been observed.16
Three events are known in the direction of the Magellanic Clouds in
which more than just t
E could be measured. In all three cases the lenses are
most likely located in the Magellanic Clouds themselves (an effect
called self-lensing) and not in the halo of the Milky Way. If for
those three cases, where the degeneracy between lens mass,
distance, and transverse velocity can be broken, the respective
lenses are not MACHOs in the Galactic halo, we might then suspect
that in most of the other microlensing events the lens is not a
MACHO either. Therefore, it is currently unclear how to interpret
the results of the MACHO survey. In particular, it is unclear to
what extent self-lensing contributes to the results. Furthermore,
the quantitative results depend on the halo model.
The EROS collaboration used an observation
strategy which was sightly different from that of the MACHO group,
by observing a number of fields in very short time intervals. Since
the duration of a lensing event depends on the mass of the lens as
Δ t ∝ M 1∕2—see (2.91)—they were also able
to probe very small MACHO masses. The absence of lensing events of
very short duration then allowed them to derive limits for the mass
fraction of such low-mass MACHOs, as is shown in Fig. 2.39. In particular,
neither the EROS nor the OGLE group could reproduce the relatively
large event rate found by the MACHO group; indeed, the EROS and
OGLE results do not require any unknown component of compact
objects in our Milky Way, and OGLE derived an upper bound
of ∼ 2 % of the dark matter
in our Milky Way which could be in the form of compact
objects.
We have to emphasize that the microlensing
surveys have been enormously successful experiments because they
accomplished exactly what was expected at the beginning of the
observations. They measured the lensing probability in the
direction of the Magellanic Clouds and the Galactic bulge, excluded
the possibility that a major fraction of the dark matter is in
compact objects, and revealed the structure of the Galactic
bulge.
The microlensing surveys did not constrain the
density of compact objects with masses ≳ 10M ⊙, since the variability
time-scale from such high-mass lenses becomes comparable to the
survey duration. Whereas such high-mass MACHOs are physically even
less plausible than ∼ 0. 5 M ⊙ candidates, it still
would be good to be able to rule them out. This can be done by
studying wide binary systems in the stellar halo. If the dark
matter in our Galaxy would be present in form of high-mass MACHOs,
these would affect the binary population, in particular by
disrupting wide binaries. From considering the separation
distribution of halo binaries, it can be excluded that high-mass
compact objects constitute the dark matter in the Galactic
halo.
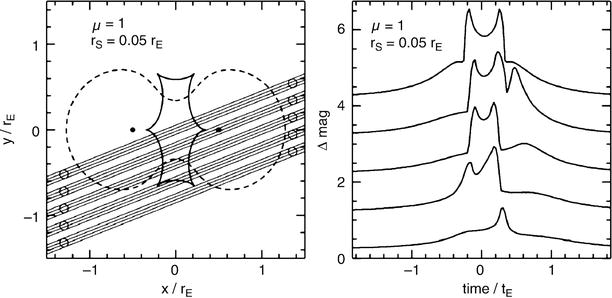
Fig. 2.40
If a binary star acts as a lens,
significantly more complicated light curves can be generated. In
the left-hand panel tracks
are plotted for five different relative motions of a background
source; the dashed curve is
the so-called critical
curve, formally defined by  ,
and the solid line is the
corresponding image of the critical curve in the source plane,
called a caustic. Light
curves corresponding to these five tracks are plotted in the
right-hand panel. If the
source crosses the caustic, the magnification μ becomes very large—formally infinite
if the source was point-like. Since it has a finite extent,
μ has to be finite as well;
from the maximum μ during
caustic crossing, the radius of the source can be determined, and
sometimes even the variation of the surface brightness across the
stellar disk, an effect known as limb darkening. Source: B.
Paczyński 1996, Gravitational
Microlensing in the Local Group ARA&A 34, 419,
p. 435, 434. Reprinted, with permission, from the Annual Review of Astronomy &
Astrophysics, Volume 34 ©1996 by Annual Reviews www.annualreviews.org
,
and the solid line is the
corresponding image of the critical curve in the source plane,
called a caustic. Light
curves corresponding to these five tracks are plotted in the
right-hand panel. If the
source crosses the caustic, the magnification μ becomes very large—formally infinite
if the source was point-like. Since it has a finite extent,
μ has to be finite as well;
from the maximum μ during
caustic crossing, the radius of the source can be determined, and
sometimes even the variation of the surface brightness across the
stellar disk, an effect known as limb darkening. Source: B.
Paczyński 1996, Gravitational
Microlensing in the Local Group ARA&A 34, 419,
p. 435, 434. Reprinted, with permission, from the Annual Review of Astronomy &
Astrophysics, Volume 34 ©1996 by Annual Reviews www.annualreviews.org2.5.4 Variations and extensions
Besides the search for MACHOs, microlensing
surveys have yielded other important results and will continue to
do so in the future. For instance, the distribution of stars in the
Galaxy can be measured by analyzing the lensing probability as a
function of direction. A huge number of variable stars have been
newly discovered and accurately monitored; the extensive and
publicly accessible databases of the surveys form an invaluable
resource for stellar astrophysics. Proper motions of several
million stars have been determined, based on ∼ 20 yr of
microlensing surveys. Furthermore, globular clusters in the LMC
have been identified from these photometric observations.
For some lensing events, the radius and the
surface structure of distant stars can be measured with very high
precision. This is possible because the magnification μ depends on the position of the
source. Situations can occur, for example where a binary star acts
as a lens (see Fig. 2.40), in which the dependence of the
magnification on the position in the source plane is very
sensitive. Since the source—the star—is in motion relative to the
line-of-sight between Earth and the lens, its different regions are
subject to different magnification, depending on the time-dependent
source position. A detailed analysis of the light curve of such
events then enables us to reconstruct the light distribution on the
surface of the star. The light curve of one such event is shown in
Fig. 2.41.
For these lensing events the source can no longer be assumed to be
a point source. Rather, the details of the light curve are
determined by its light distribution. Therefore, another
length-scale appears in the system, the radius of the star. This
length-scale shows up in the corresponding microlensing light
curve, as can be seen in Fig. 2.41, by the time-scale which characterizes the
width of the peaks in the light curve—it is directly related to the
ratio of the stellar radius and the transverse velocity of the
lens. With this new scale, the degeneracy between M, v, and D d is partially broken, so
that these special events provide more information than the
‘classical’ ones.

Fig. 2.41
Light curve of an event in which the lens
was a binary star. Note the qualitative similarity of this light
curve with the second one from the top in Fig. 2.40. The MACHO group
discovered this ‘binary event’. Members of the PLANET collaboration
obtained this data using four different telescopes (in Chile,
Tasmania, and South Africa). The second caustic crossing is highly
resolved (displayed in the small
diagram) and allows us to draw conclusions about the size
and the brightness distribution of the source star. The two curves
show the fits of a binary lens to the data. Source: M.D. Albrow et
al. 1999, The Relative Lens-Source
Proper Motion in MACHO 98-SMC-1, ApJ 512, 672, p. 674,
Fig. 2. ©AAS. Reproduced with permission
In fact, the light curve in Fig. 2.36 is probably not
caused by a single lens star, but instead by additional slight
disturbances from a companion star. This would explain the
deviation of the observed light curve from a simple model light
curve. However, the sampling in time of this particular light curve
is not sufficient to determine the parameters of the binary
system.
By now, detailed light curves with very good time
coverage have been measured, which was made possible with an alarm
system. The data from those groups searching for microlensing
events are analyzed immediately after observations, and potential
candidates for interesting events are published on the Internet.
Other groups (such as the PLANET collaboration, for example) then
follow-up these systems with very good time coverage by using
several telescopes spread over a large range in geographical
longitude. This makes around-the-clock observations of the events
possible. Using this method, light curves of extremely high quality
have been measured, and events in which the lens is a binary with a
very large mass ratio have been detected—so large that the lighter
of the two masses is not a star, but a planet. Indeed, more than a
dozen extrasolar planets have been found by microlensing surveys.
Whereas this number at first sight is not so impressive, given that
many more extrasolar planets were discovered by other methods, the
selection function in microlensing surveys is quite different. In
contrast to the radial velocity method (where the periodic change
of the radial velocity of the parent star, caused by its motion
around the center of mass of the star-planet system, is measured),
microlensing has detected lower-mass planets and planets at larger
separation from the host star.
2.6 The Galactic center
The Galactic center (GC, see Fig. 2.42) is not observable
at optical wavelengths, because the extinction in the V band is ∼ 28 mag. Our information
about the GC has been obtained from radio-, IR-, and X-ray
radiation, although even in the K-band, the extinction is
still ∼ 3 mag. Since the GC is nearby, and thus serves as a
prototype of the central regions of galaxies, its observation is of
great interest for our understanding of the processes taking place
in the centers of galaxies.
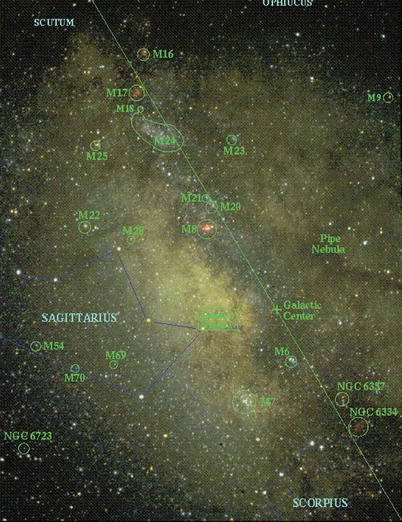
Fig. 2.42
Optical image in the direction of the
Galactic center. The size of the image is ∼ 10∘×
15∘. Marked are some Messier objects: gas nebulae such
as M8, M16, M17, M20; open star clusters such as M6, M7, M18, M21,
M23, M24, and M25; globular clusters such as M9, M22, M28, M54,
M69, and M70. Also marked is the Galactic center, as well as the
Galactic plane, which is indicated by a line. Baade’s Window can be easily
recognized, a direction in which the extinction is significantly
lower than in nearby directions, so that a clear increase in
stellar density is visible there. This is the reason why the
microlensing observations towards the Galactic center were
preferably done in Baade’s Window. Credit: W. Keel (U. Alabama,
Tuscaloosa), Cerro Tololo, Chile
2.6.1 Where is the Galactic center?
The question of where the center of our Milky Way
is located is by no means trivial, because the term ‘center’ is in
fact not well-defined. Is it the center of mass of the Galaxy, or
the point around which the stars and the gas are orbiting? And how
could we pinpoint this ‘center’ accurately? Fortunately, the center
can nevertheless be localized because, as we will see below, a
distinct source exists that is readily identified as the Galactic
center.

Fig. 2.43
Left: A VLA wide-field image of the
region around the Galactic center, with a large number of sources
identified. Upper right: a
20 cm continuum VLA image of Sgr A East. Center right: Sgr A West, as seen in a
6-cm continuum VLA image, where the red dot marks Sgr
A∗. Lower right:
the circumnuclear ring in HCN line emission. Source: Left: N.E. Kassim, from T.N. LaRosa et
al. 2000, A Wide-Field 90
Centimeter VLA Image of the Galactic Center Region, AJ 119,
207, P. 209, Fig. 1. ©AAS. Reproduced with permission. Credit:
Produced by the U.S. Naval Research Laboratory by Dr. N.E. Kassim
and collaborators from data obtained with the National Radio
Astronomy’s Very Large Array Telescope, a facility of the National
Science Foundation operated under the cooperative agreement with
associated Universities, Inc. Basic research in radio astronomy is
supported by the U.S. Office of Naval Research. Upper right: from
R.L. Plante et al. 1995, The
magnetic fields in the galactic center: Detection of H1 Zeeman
splitting, ApJ 445, L113, Fig. 1. ©AAS. Reproduced with
permission. Center right: Image courtesy of NRAO/AUI, National
Radio Astronomy Observatory. Lower right: Image courtesy of Leo
Blitz and Hat Creek Observatory
Radio observations in the direction of the GC
show a relatively complex structure, as is displayed in
Fig. 2.43. A
central disk of Hi gas
exists at radii from several 100 pc up to about 1 kpc. Its
rotational velocity yields an estimate of the enclosed mass
M(R) for R ≳ 100 pc. Furthermore, radio
filaments are observed which extend perpendicularly to the Galactic
plane, and a large number of supernova remnants are seen. Within
about 2 kpc from the center, roughly 3 × 10⁷
M ⊙ of atomic
hydrogen is found. Optical images show regions close to the GC
towards which the extinction is significantly lower. The best known
of these is Baade’s Window —most of the microlensing surveys
towards the bulge are conducted in this region. It is the brightest
region in Fig. 2.42, not because the stellar density is
highest there, but the obscuration is smallest. In addition, a
fairly large number of globular clusters and gas nebulae are
observed towards the central region. X-ray images
(Fig. 2.44)
show numerous X-ray binaries, as well as diffuse emission by hot
gas.
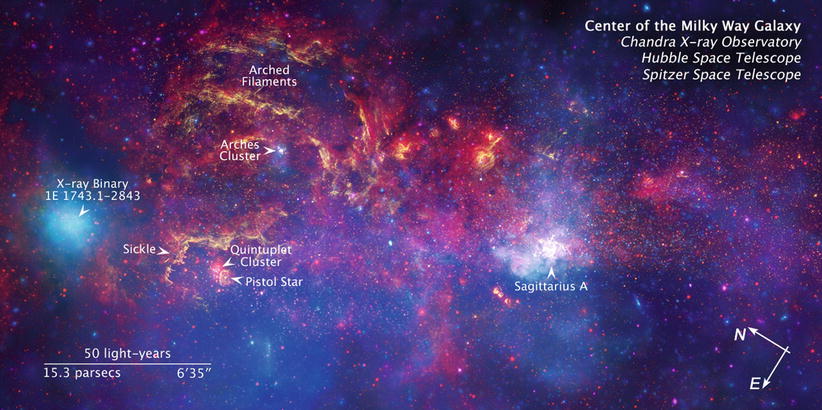
Fig. 2.44
A composite image of the Galactic center:
X-ray emission as observed by Chandra is shown in blue, mid-infrared emission (Spitzer)
shown in red, and near-IR
radiation (HST) in yellow-brown. The long side of the
image is 32. ′ 5, corresponding to ∼ 75 pc at
the distance of the Galactic center. The Galactic center, in which
a supermassive black hole is suspected to reside, is the bright
white region to the right of the center of this image. The X-ray
image contains hundreds of white dwarfs, neutron stars, and black
holes that radiate in the X-ray regime due to accretion phenomena
(accreting X-ray binaries). The diffuse X-ray emission originates
in diffuse hot gas with a temperature of about T ∼ 107 K. Credit: NASA,
ESA, CXC, SSC, and STScI
The innermost 8 pc contain the radio source Sgr A
(Sagittarius A), which itself consists of different components:
-
A circumnuclear molecular ring, shaped like a torus, which extends between radii of 2 pc ≲ R ≲ 8 pc and is inclined by about 20∘ relative to the Galactic disk. The rotational velocity of this ring is about ∼ 110 km∕s, nearly independent of R. This ring has a sharp inner boundary; this cannot be the result of an equilibrium flow, because internal turbulent motions would quickly (on a time scale of ∼ 105 yr) blur this boundary. Probably, it is evidence of an energetic event that occurred in the Galactic center within the past ∼ 105 yr. This interpretation is also supported by other observations, e.g., by a clumpiness in density and temperature.
-
Sgr A East, a non-thermal (synchrotron) source of shell-like structure. Presumably this is a supernova remnant (SNR), with an age between 100 and 5000 years.
-
Sgr A West is located about 1. ′ 5 away from Sgr A East. It is a thermal source, an unusual Hii region with a spiral-like structure.
-
Sgr A∗ is a compact radio source close to the center of Sgr A West. Recent observations with mm-VLBI show that its extent is smaller than about 1 AU. The radio luminosity is L rad ∼ 2 × 1034 erg∕s. Except for the emission in the mm and cm domain, Sgr A∗ is a weak source. Since other galaxies often have a compact radio source in their center, Sgr A∗ is an excellent candidate for being the center of our Milky Way.
Through observations of stars which contain a
radio maser17
source, the astrometry of the GC in the radio domain was matched to
that in the IR, i.e., the position of Sgr A∗ is also
known in the IR.18
The uncertainty in the relative positions between radio and IR
observations is only ∼ 30 mas—at a presumed distance of the GC of
8 kpc, 1 arcsec corresponds to 0.0388 pc, or about 8000 AU.
2.6.2 The central star cluster
Density
distribution. Observations in the K-band (λ ∼ 2μm) show a compact star cluster
that is centered on Sgr A∗. Its density behaves
like ∝ r −1. 8
within the distance range 0. 1 pc ≲ r ≲ 1 pc. The number density of stars
in its inner region is so large that close stellar encounters may
be common. It can be estimated that a star has a close encounter
about every ∼ 106 yr. Thus, it is expected that the
distribution of the stars is ‘thermalized’, which means that the
local velocity distribution of the stars is the same everywhere,
i.e., it is close to a Maxwellian distribution with a constant
velocity dispersion. For such an isothermal distribution we expect
a density profile n ∝ r −2, which is in good
agreement with the observation. Most of the stars in the nuclear
star cluster have an age ≳ 1 Gyr; they are late-type giant
stars.
In addition, young O and B stars are found in the
central parsec. From their spectroscopic observations, it was
inferred that almost all of these hot, young stars reside in one of
two rotating thick disks. These disks are strongly inclined to the
Galactic plane, one rotates ‘clockwise’ around the GC, the other
‘counterclockwise’. These two disks have a clearly defined inner
edge at about 1″, corresponding to 0. 04 pc, and a surface mass
density ∝ r −2.
The age of these early-type stars is 6 ± 2 Myr, i.e., of the same
order as the time between two strong encounters.
Another observational result yields a striking
and interesting discrepancy with respect to the idea of an
isothermal distribution. Instead of the expected constant
dispersion σ of the radial
velocities of the stars, a strong radial dependence is observed:
σ increases towards smaller
r. For example, one finds
σ ∼ 55 km∕s at r = 5 pc, but σ ∼ 180 km∕s at r = 0. 15 pc. This discrepancy
indicates that the gravitational potential in which the stars are
moving is generated not only by themselves. According to the virial
theorem, the strong increase of σ for small r implies the presence of a central
mass concentration in the star cluster.
The origin of very
massive stars near the GC. One of the unsolved problems is
the presence of these massive stars close to the Galactic center.
One finds that most of the innermost stars are main-sequence
B-stars. Their small lifetime of ∼ 108 yr probably
implies that these stars were born close to the Galactic center.
This, however, is very difficult to understand. Both the strong
tidal gravitational field of the central black hole (see below) and
the presumably strong magnetic field in this region will prevent
the ‘standard’ star-formation picture of a collapsing molecular
cloud: the former effect tends to disrupt such a cloud while the
latter stabilizes it against gravitational contraction. In order to
form the early-type stars found in the inner parsec of the Galaxy,
the gas clouds need to be considerably denser than currently
observed, but may have been at some earlier time during a phase of
strong gas infall. Several other solutions to this problem have
been suggested. Perhaps the most plausible is a scenario in which
the stars are born at larger distances from the Galactic center and
then brought there by dynamical processes, involving strong
gravitational scattering events. If a stellar binary has an orbit
which brings it close to the central region, the strong tidal
gravitational field can disrupt the binary, with one of its star
being brought into a gravitationally bound orbit around the black
hole, and the other being expelled from the central region.
Proper
motions. Since the middle of the 1990s, proper motions of
stars in this star cluster have also been measured, using the
methods of speckle interferometry and adaptive optics. These
produce images at diffraction-limited angular resolution,
about ∼ 0. ′
′ 15 in the K-band at the ESO/NTT (3.5 m) and
about ∼ 0. ′
′ 05 at 10 m-class telescopes. Proper motions are
currently known for about 6000 stars within ∼ 1 pc of Sgr
A∗, of which some 700 additionally have radial velocity
measurements, so that their three-dimensional velocity vector is
known. The radial and tangential velocity dispersions resulting
from these measurements are in good mutual agreement. Thus, it can
be concluded that a basically isotropic distribution of the stellar
orbits exists, simplifying the study of the dynamics of this
stellar cluster.
2.6.3 A black hole in the center of the Milky Way
The S-star
cluster. Whereas the distribution of young A-stars in the
nuclear disks shows a sharp cut-off at around 1″, there is a
distribution of stars within ∼ 1″ of Sgr A∗ which is
composed mainly of B-stars; these are known as the S-star cluster.
Some stars of this cluster have a proper motion well in excess of
1000 km∕s, up to ∼ 10000 km∕s. Combining the velocity dispersions
in radial and tangential directions reveals them to be increasing
according to the Kepler law for the presence of a point mass,
 down to r ∼ 0. 01 pc.
down to r ∼ 0. 01 pc.
Fig. 2.45
The left
figure shows the orbits of about two dozen stars in the
central arcsecond around Sgr A∗, as determined from
their measured proper motions and radial velocity. For one of the
stars, denoted by S2, a full orbit has been observed, as shown in
the upper right panel. The
data shown here were obtained between 1992 and 2008, using data
taken with the NTT and the VLT (blue points) and the Keck telescopes
(red points). The orbital
time is 15. 8 yr, and the orbit has a strong eccentricity. The
lower right panel shows the
radial velocity measurements of S2. In both of the right panels, the best fitting model
for the orbital motion is plotted as a curve. Source: Left: S. Gillessen et al. 2009,
Monitoring Stellar Orbits Around
the Massive Black Hole in the Galactic Center, ApJ 692,
1075, p. 1096, Fig. 16. ©AAS. Reproduced with permission.
Right: S. Gillessen et al.
2009, The Orbit of the Star S2
Around SGR A ∗ from Very Large Telescope and Keck
Data, ApJ 707, L114, p. L115, L116, Figs. 2 & 3.
©AAS. Reproduced with permission

Fig. 2.46
Determination of the mass M(r) within a radius r from Sgr A∗, as measured
by the radial velocities and proper motions of stars in the central
cluster. Mass estimates obtained from individual stars (S14, S2,
S12) are given by the points with error bars for small r. The other data points were derived
from the kinematic analysis of the observed proper motions of the
stars, where different methods have been applied. As can be seen,
these methods produce results that are mutually compatible, so that
the shape of the mass profile plotted here can be regarded to be
robust, whereas the normalization depends on R 0 which was assumed to be
8 kpc for this figure. The solid
curve is the best-fit model, representing a point mass of
2. 9 × 10⁶ M
⊙ plus a star cluster with a central density of
 (the
mass profile of this star cluster is indicated by the dash-dotted curve). The dashed curve shows the mass profile of
a hypothetical cluster with a very steep profile, n ∝ r −5, and a central density
of
(the
mass profile of this star cluster is indicated by the dash-dotted curve). The dashed curve shows the mass profile of
a hypothetical cluster with a very steep profile, n ∝ r −5, and a central density
of  .
Source: R. Schödel et al. 2003, Stellar Dynamics in the Central Arcsecond of
Our Galaxy, ApJ 596, 1015, p. 1027, Fig. 11. ©AAS.
Reproduced with permission
.
Source: R. Schödel et al. 2003, Stellar Dynamics in the Central Arcsecond of
Our Galaxy, ApJ 596, 1015, p. 1027, Fig. 11. ©AAS.
Reproduced with permission
(the
mass profile of this star cluster is indicated by the dash-dotted curve). The dashed curve shows the mass profile of
a hypothetical cluster with a very steep profile, n ∝ r −5, and a central density
of .
Source: R. Schödel et al. 2003, Stellar Dynamics in the Central Arcsecond of
Our Galaxy, ApJ 596, 1015, p. 1027, Fig. 11. ©AAS.
Reproduced with permissionBy now, the acceleration of some stars in the star
cluster has also been measured, i.e., the change of proper motion
with time, which is a direct measure of the gravitational force.
From these measurements Sgr A∗ indeed emerges as the
focus of the orbits and thus as the center of mass.
For ∼ 25 members of the S-star cluster, the information from
proper motion and radial velocity measurements allowed the
reconstruction of orbits; these are shown in the left-hand panel of
Fig. 2.45.
For one of these stars, S2, observations between 1992 and 2008 have
covered a full orbit around Sgr A∗, with an orbital
period of 15. 8 yr, as shown in the right panels of
Fig. 2.45.
Its velocity exceeded 5000 km∕s when it was closest to Sgr
A∗. The minimum separation of this star from Sgr
A∗ then was only 6 × 10⁻⁴ pc, or about
100 AU. In 2012, a new S-star with a period of only 11. 5 yr
wasdiscovered.
From the observed kinematics of the stars, the
enclosed mass M(r)
can be calculated, see Fig. 2.46. The corresponding analysis yields that
M(r) is basically constant over the range
0. 01 pc ≲ r ≲ 0. 5 pc.
This exciting result clearly indicates the presence of a point
mass. The precise value of this mass is a bit uncertain, mainly due
to the uncertainty in the distance of the Galactic center from us.
A characteristic value obtained from recent analysis yields a
distance to the Galactic center of R 0 ≈ 8. 3 kpc, and a
blackhole mass of
 which is slightly larger than the estimate based on the data shown
in Fig. 2.46.
For radii above ∼ 1 pc, the mass of the star cluster dominates; it
nearly follows an isothermal density distribution with a core
radius of ∼ 0. 34 pc and a central density of
which is slightly larger than the estimate based on the data shown
in Fig. 2.46.
For radii above ∼ 1 pc, the mass of the star cluster dominates; it
nearly follows an isothermal density distribution with a core
radius of ∼ 0. 34 pc and a central density of  . This
result is also compatible with the kinematics of the gas in the
center of the Galaxy. However, stars are much better kinematic
indicators because gas can be affected by magnetic fields,
viscosity, and various other processes besides gravity.
. This
result is also compatible with the kinematics of the gas in the
center of the Galaxy. However, stars are much better kinematic
indicators because gas can be affected by magnetic fields,
viscosity, and various other processes besides gravity.
(2.94)
. This
result is also compatible with the kinematics of the gas in the
center of the Galaxy. However, stars are much better kinematic
indicators because gas can be affected by magnetic fields,
viscosity, and various other processes besides gravity.The kinematics of stars in the
central star cluster of the Galaxy shows that our Milky Way
contains a mass concentration in which ∼ 4 × 10⁶
M ⊙ are
concentrated within a region smaller than 0.01 pc. This is almost
certainly a black hole in the center of our Galaxy, at the position
of the compact radio source Sgr A∗.
Why a black
hole? We have interpreted the central mass concentration as
a black hole; this requires some further explanation:
-
The energy for the central activity in quasars, radio galaxies, and other AGNs is produced by accretion of gas onto a supermassive black hole (SMBH); we will discuss this in more detail in Sect. 5.3. Thus we know that at least a sub-class of galaxies contains a central SMBH. Furthermore, we will see in Sect. 3.8 that many ‘normal’ galaxies, especially ellipticals, harbor a black hole in their center. The presence of a black hole in the center of our own Galaxy would therefore not be something unusual.
-
To bring the radial mass profile M(r), as inferred from the stellar kinematics, into accordance with an extended mass distribution, its density distribution must be very strongly concentrated, with a density profile steeper than ∝ r −4; otherwise the mass profile M(r) would not be as flat as observed and shown in Fig. 2.46. Hence, this hypothetical mass distribution must be vastly different from the expected isothermal distribution which has a mass profile ∝ r −2, as discussed in Sect. 2.6.2. However, observations of the stellar distribution provide no indication of an inwardly increasing density of the star cluster with such a steep profile.
-
Even if such an ultra-dense star cluster (with a central density of
 )
was present it could not be stable, but instead would dissolve
within ∼ 107 yr through frequent stellar
collisions.
)
was present it could not be stable, but instead would dissolve
within ∼ 107 yr through frequent stellar
collisions. -
Sgr A∗ itself has a proper motion of less than 20 km/s. It is therefore the dynamical center of the Milky Way. Due to the large velocities of its surrounding stars, one would derive a mass of
 for the radio source,
assuming equipartition of energy (see also Sect. 2.6.4). Together with the
tight upper bounds for its extent, a lower limit for the density of
for the radio source,
assuming equipartition of energy (see also Sect. 2.6.4). Together with the
tight upper bounds for its extent, a lower limit for the density of
 can then
beobtained.
can then
beobtained.
We have to emphasize at this point that the
gravitational effect of the black hole on the motion of stars and
gas is constrained to the innermost region of the Milky Way. As one
can see from Fig. 2.46, the gravitational field of the SMBH
dominates the rotation curve of the Galaxy only for R ≲ 2 pc—this is the very reason why
the detection of the SMBH is so difficult. At larger radii, the
presence of the SMBH is of no relevance for the rotation curve of
the Milky Way.

Fig. 2.47
The position of Sgr A∗ at
different epochs, relative to the position in 1996. To a very good
approximation the motion is linear, as indicated by the dashed
best-fit straight line. In
comparison, the solid line
shows the orientation of the Galactic plane. Source: M. Reid &
A. Brunthaler 2004, The Proper
Motion of Sagittarius A ∗ . II. The Mass of Sagittarius A
∗, ApJ 616, 872, p. 875, Fig. 1. ©AAS. Reproduced
with permission
2.6.4 The proper motion of Sgr A∗
From a series of VLBI observations of the
position of Sgr A∗, covering 8 years, the proper motion
of this compact radio source was measured with very high precision.
To do this, the position of Sgr A∗ was determined
relative to two compact extragalactic radio sources. Due to their
large distances these are not expected to show any proper motion,
and the VLBI measurements show that their separation vector is
indeed constant over time. The position of Sgr A∗ over
the observing period is plotted in Fig. 2.47.
From the plot, we can conclude that the observed
proper motion of Sgr A∗ is essentially parallel to the
Galactic plane. The proper motion perpendicular to the Galactic
plane is about 0. 2 mas∕yr, compared to the proper motion in the
Galactic plane of 6. 4 mas∕yr. If R 0 = (8. 0 ± 0. 5) kpc is
assumed for the distance to the GC, this proper motion translates
into an orbital velocity of (241 ± 15) km∕s, where the uncertainty
is dominated by the exact value of R 0 (the error in the
measurement alone would yield an uncertainty of only 1 km∕s). This
proper motion is easily explained by the Solar orbital motion
around the GC, i.e., this measurement contains no hint of a
non-zero velocity of the radio source Sgr A∗ itself. In
fact, the small deviation of the proper motion from the orientation
of the Galactic plane can be explained by the peculiar velocity of
the Sun relative to the LSR (see Sect. 2.4.1). If this is taken
into account, a velocity perpendicular to the Galactic disk of
 is
obtained for Sgr A∗. The component of the orbital
velocity within the disk has a much larger uncertainty because we
know neither R 0
nor the rotational velocity V 0 of the LSR very
precisely. The small upper limit for v ⊥ suggests, however,
that the motion in the disk should also be very small. Under the
(therefore plausible) assumption that Sgr A∗ has no
peculiar velocity, the ratio
is
obtained for Sgr A∗. The component of the orbital
velocity within the disk has a much larger uncertainty because we
know neither R 0
nor the rotational velocity V 0 of the LSR very
precisely. The small upper limit for v ⊥ suggests, however,
that the motion in the disk should also be very small. Under the
(therefore plausible) assumption that Sgr A∗ has no
peculiar velocity, the ratio  can be determined from these
measurements with an as yet unmatched precision.
can be determined from these
measurements with an as yet unmatched precision.
is
obtained for Sgr A∗. The component of the orbital
velocity within the disk has a much larger uncertainty because we
know neither R 0
nor the rotational velocity V 0 of the LSR very
precisely. The small upper limit for v ⊥ suggests, however,
that the motion in the disk should also be very small. Under the
(therefore plausible) assumption that Sgr A∗ has no
peculiar velocity, the ratio can be determined from these
measurements with an as yet unmatched precision.What also makes this observation so impressive is
that from it we can directly derive a lower limit for the mass of
Sgr A∗. Since this radio source is surrounded
by ∼ 106 stars within a sphere of radius ∼ 1 pc, the net
acceleration towards the center is not vanishing, even in the case
of a statistically isotropic distribution of stars. Rather, due to
the discrete nature of the mass distribution, a stochastic force
exists that changes with time because of the orbital motion of the
stars. The radio source is accelerated by this force, causing a
motion of Sgr A∗ which becomes larger the smaller the
mass of the source. The very strong limits to the velocity of Sgr
A∗ enable us to derive a lower limit for its mass of
 . This mass limit is
significantly lower than the mass of the SMBH that was derived from
the stellar orbits, but it is the mass of the radio source itself.
Although we have excellent reasons to assume that Sgr A∗
coincides with the SMBH, the upper limit on the peculiar velocity
of Sgr A∗ is the first proof for a large mass of the
radio source itself.
. This mass limit is
significantly lower than the mass of the SMBH that was derived from
the stellar orbits, but it is the mass of the radio source itself.
Although we have excellent reasons to assume that Sgr A∗
coincides with the SMBH, the upper limit on the peculiar velocity
of Sgr A∗ is the first proof for a large mass of the
radio source itself.2.6.5 Flares from the Galactic center
Observation of
flares. In 2000, the X-ray satellite Chandra discovered a
powerful X-ray flare from Sgr A∗. This event lasted for
about 3 h, and the X-ray flux increased by a factor of 40 during
this period. XMM-Newton confirmed the existence of X-ray flares,
recording one where the luminosity increased by a factor of ∼ 200.
Most of the flares seen, however, have a much smaller peak
amplitude, of a few to ten times the quiescent flux of the source,
and the typical flare duration is ∼ 30 min. During the flares,
variability of the X-flux on time-scales of several minutes is
observed. Combining the flare duration with the short time-scale of
variability of a few minutes indicates that the emission must
originate from a very small source, not larger
than ∼ 1013 cm in size.

Fig. 2.48
Variability of Sgr A∗ is shown
here in simultaneous observations at four different wavelengths,
carried out in May 2009. The red
bars in each panel are the error bars of the observed flux,
from which the quiescent flux level was subtracted, with their
central values connected with a thin line. The thick solid curve corresponds to a
model for the flare emission across the wavebands, whereas the
other three curves (dashed,
blue and red) are individual components of this
model. One sees that the first flare occurs at all wavelength,
whereas the second, main flare, was not covered by the near-IR
observations. Source: A. Eckart et al. 2012, Millimeter to X-ray flares from Sagittarius
A ∗, A&A 537, A52, Fig. 1. ©ESO. Reproduced
with permission
Monitoring Sgr A∗ at longer
wavelengths, variability was found as well.
Figure 2.48 shows the simultaneous lightcurves of Sgr
A∗ during one night in May 2009. The source flared in
X-rays, with two flares close in time. These flares are also seen
at the near-IR, sub-mm and mm wavelengths, nearly simultaneously.
Flares are seen more frequently in the NIR than in X-rays,
occurring several times per day, where X-ray flares occur about
once per day. Simultaneous observations, such as those in
Fig. 2.48,
indicate that every X-ray flare is accompanied by a flare in the
NIR; the converse is not true, however. It thus seems that the
flares in the different wavelength regimes have a common origin.
From a set of such simultaneous observing campaigns, it was found
that there is a time lag between the variations at different
wavelengths. Typically, NIR flares occur ∼ 2 h earlier than those
seen at (sub-)mm wavelengths, and they are narrower, whereas the
X-ray and NIR flares are essentially simultaneous.
There was some discussion about a possible
quasi-periodicity of the NIR light curves, but the observational
evidence for this is not unambiguous. Nevertheless, polarization
observation of Sgr A∗ may provide support for a model in
which the variability is caused by a source moving around the
central black hole. Anticipating our discussion about AGN in
Chap. 5, the model assumes that there is a
‘hot spot’ on the surface of an accretion disk, whereby
relativistic effects modulate the received flux from this source
component as it orbits around the black hole.
X-ray
echos. With a mass of  ,
the central black hole in the Milky Way could in principle power a
rather luminous active galactic nucleus, such as is observed in
other active galaxies, e.g., Seyfert galaxies. This, however, is
obviously not the case—the luminosity of Sgr A∗ is many
orders of magnitudes smaller than the nucleus in Seyfert galaxies
with similar mass central black holes (see Chap. 5). The reason for the inactivity of
our Galactic center is therefore not the black hole mass, but the
absence of matter which is accreted onto it. The fact that the
Galactic center region emits thermal radiation in the X-rays shows
the presence of gas. But this gas cannot flow to the central black
hole, presumably because of its high temperature and associated
high pressure. This line of argument is supported by the fact that
the central X-ray source is resolved, and hence much more extended
than the Schwarzschild radius of the black hole, where the bulk of
the energy generation by accretion takes place (see
Sect. 5.3.2 for more details). However,
the variability of Sgr A∗ may be seen as an indication
that the accretion rate can change in the course of time.
,
the central black hole in the Milky Way could in principle power a
rather luminous active galactic nucleus, such as is observed in
other active galaxies, e.g., Seyfert galaxies. This, however, is
obviously not the case—the luminosity of Sgr A∗ is many
orders of magnitudes smaller than the nucleus in Seyfert galaxies
with similar mass central black holes (see Chap. 5). The reason for the inactivity of
our Galactic center is therefore not the black hole mass, but the
absence of matter which is accreted onto it. The fact that the
Galactic center region emits thermal radiation in the X-rays shows
the presence of gas. But this gas cannot flow to the central black
hole, presumably because of its high temperature and associated
high pressure. This line of argument is supported by the fact that
the central X-ray source is resolved, and hence much more extended
than the Schwarzschild radius of the black hole, where the bulk of
the energy generation by accretion takes place (see
Sect. 5.3.2 for more details). However,
the variability of Sgr A∗ may be seen as an indication
that the accretion rate can change in the course of time.Maybe there have been times when the luminosity
of Sgr A∗ was considerably larger than it is currently.
Indeed, there are some indications for this being the case. Photons
emitted at earlier times than the ones we observe now from Sgr
A∗ may still reach us today, if they were scattered by
electrons, or if these photons have exited gas that, as a
consequence, emits radiation. In both cases, the total light-travel
time from the source to us would be larger, since the geometric
light path is longer. We may therefore see the evidence of past
activity as a light echo of radiation, which reaches us from
slightly different directions.
There is now strong evidence for such a light
echo. Hard X-ray radiation can lead to the removal of a strongly
bound electron in iron, which subsequently emits a fluorescence
line at 6. 4 keV. The distribution of this iron line radiation in a
region close to Sgr A∗ is shown in Fig. 2.49. This region
contains a large number of molecular clouds, i.e., high-density
neutral gas. The images in Fig. 2.49 show the variation of this line flux over
a time period of about 5 year. We see that the spatial distribution
of this line flux changes over this time-scale, with the flux
increasing to the left part of this region as time progresses. The
apparent velocity, with which the peak of the line emission moves
across the region, is considerably larger than the speed of
light—it shows superluminal motion. This evidence has recently been
further strengthened with Chandra observations of the same region
showing variations on even shorter time-scales. This high velocity,
however, is not necessarily a violation of Einstein’s Special
Relativity. In fact, this phenomenon can be easily understood in
the framework of a reflection model: Suppose there is a screen of
scattering material between us and a source. The further away a
point in the screen is from the line connecting us and the source,
the larger is the geometrical path of a ray which propagates to
this point in the screen, and is scattered there towards our
direction. The scattered radiation from a flare in the source will
thus appear at different points in the screen as time progresses,
and the speed with which the point changes in the screen can exceed
the speed of light, without violating relativity; this will be
shown explicitly in Problem 2.6. The argument is the same, independent of
whether the light is scattered, or if a fluorescence line is
excited. In fact, the material responsible for the light echo does
not need to be located between us and the source, it can also be
located behind the source.

Fig. 2.49
The flux distribution of the 6. 4 keV iron
line in the region of molecular clouds near the Galactic center, at
four different epochs. These XMM observations show that the flux
distribution is changing on time-scales of a few years. However,
the size of the region is much larger than a few light years—see
the scale bar in the lower right
panel. Thus, it seems that the variations are propagating
through this region with a velocity larger than the speed of light.
The explanation for this phenomenon is the occurrence of a light
echo. Sgr A∗ is located in the direction indicated by
the white arrow in the
upper right panel, at a
projected distance of about 40 light-years from the molecular cloud
MC2. Source: G. Ponti et al. 2010, Discovery of a Superluminal Fe K Echo at the
Galactic Center: The Glorious Past of Sgr A* Preserved by Molecular
Clouds, ApJ 714, 732, p. 742, Fig. 10. ©AAS. Reproduced
with permission
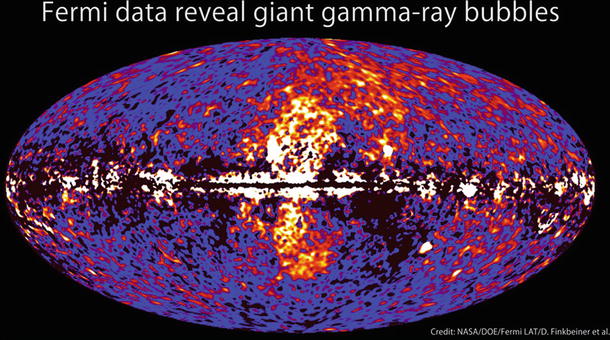
Fig. 2.50
Gamma-ray map of the sky in the energy
range between 1 and 10 GeV. The Fermi-bubbles show up above and
below the Galactic center, extending up to ∼ 50∘ from
the disk. Credit: NASA/DOE/Fermi LAT/D. Finkbeiner et al.
In fact, this phenomenon has not only be seen in
the region shown in Fig. 2.49. The massive molecular cloud Sgr B2 also
shows the prominent fluorescence line of iron, as well as X-ray
continuum emission. The line and continuum flux decreased by a
factor ∼ 2 over a time-scale of ∼ 10 yr—whereas the extent of the
molecular cloud is much larger than ten light-years. Furthermore,
there is no strong X-ray source known close to Sgr B2 which would
be able to power the fluorescence line.
These observations are compatible with a model in
which Sgr A∗ had a strong flare some 100 yr ago, and
what we see are the light echos of this flare. The luminosity of
the flare must have exceeded 2 × 1039 erg∕s in the X-ray
regime, and it must have faded rather quickly, in order to generate
such short-term variations of the echo. The location of the flare
must be located in a region close to Sgr A∗, though one
cannot conclude with certainty that Sgr A∗ was the exact
location—there are several compact stellar remnants in its
immediate vicinity which may have caused such a flare.
Nevertheless, the requested luminosity is higher than that one
usually assigns to compact stellar-mass objects, and Sgr
A∗ as the putative source of the flare appears quite
likely. Hence, the light echo phenomenon gives us an opportunity to
look back in time.
The Fermi
bubbles. Another potential hint for an increased nuclear
activity of the Galactic center was found with the Fermi satellite.
It discovered two large structures in gamma-rays above and below
the Galactic center, extending up to a Galactic latitude
of | b | ≲ 50∘,
i.e., a spatial scale of ∼ 8 kpc from the center of the Milky Way
(see Fig. 2.50). Emission from these regions is seen in
the energy range between 1 and 100 GeV, with a hard energy
spectrum, much harder than the diffuse gamma-ray emission from the
Milky Way. The two ‘Fermi bubbles’ are associated with an enhanced
microwave emission, seen by the WMAP and Planck satellites (the
so-called microwave ‘haze’), and appear to have well-defined edges,
which are also seen in X-rays. Furthermore, almost spatially
coincident giant radio lobes with strong linear polarization were
detected.
The origin of the Fermi bubbles is currently
strongly debated in the literature. One possibility is strongly
enhanced activity of Sgr A∗ in the past, that drove out
a strong flow of energetic plasma—similar to AGNs—and whose remnant
we still see. Alternatively, the Galactic center region is a site
of active star formation, which may be the origin of a massive
outflow of magnetized plasma.
2.6.6 Hypervelocity stars in the Galaxy
Discovery.
In 2005, a Galactic star was discovered which travels with a
velocity of at least 700 km/s relative to the Galactic rest frame.
This B-star has a distance of 110 kpc from the Galactic center, and
its actual space velocity depends on its transverse motion which
has not yet been measured, due to the large distance of the object
from us. However, since the distance of the star is far larger than
the separation between the Sun and the Galactic center, so that the
directions Galactic center–star and Sun–star are nearly the same,
the measured radial velocity from the Sun is very close to the
radial velocity relative to the Galactic center.
The velocity of this star is so large that it
greatly exceeds the escape velocity from the Galaxy; hence, this
star is gravitationally unbound to the Milky Way. Within 4 years
after this first discovery, about 15 more such hypervelocity stars were discovered,
all of them early-type stars (O- or B-stars) with Galactic
rest-frame velocities in excess of the escape velocity at their
respective distance from the Galactic center. Hence, they will all
escape the gravitational potential of the Galaxy. Furthermore, a
larger number of stars have been detected whose velocity in the
Galactic frame exceeds ∼ 300 km∕s but is most likely not large
enough to let them escape from the gravitational field of the
Galaxy—i.e., these stars are on bound orbits. In a sample of eight
of them, all were found to move away from the Galactic center. This
indicates that their lifetime is considerable smaller than their
orbital time scale (because otherwise, if they could survive for
half an orbital period, one would expect to find also approaching
stars), yielding an upper bound on their lifetime of 2 Gyr.
Therefore, these stars are most likely on the main sequence.
Acceleration of
hypervelocity stars. The fact that the hypervelocity stars
are gravitationally unbound to the Milky Way implies that they must
have been accelerated very recently, i.e., less than a crossing
time through the Galaxy ago. In addition, since they are early-type
stars, they must have been accelerated within the lifetime of such
stars. The acceleration mechanism must be of gravitational origin
and is related to the dynamical
instability of N-body systems, with N > 2. A pair of objects will orbit
in their joint gravitational field, either on bound orbits
(ellipses) or unbound ones (gravitational scattering on hyperbolic
orbits); in the former case, the system is stable and the two
masses will orbit around each other literally forever. If more than
two masses are involved this is no longer the case—such a system is
inherently unstable. Consider three masses, initially bound to each
other, orbiting around their center-of-mass. In general, their
orbits will not be ellipses but are more complicated; in
particular, they are not periodic. Such a system is, mathematically
speaking, chaotic. A chaotic system is characterized by the
property that the state of a system at time t depends very sensitively on the
initial conditions set at time t i < t. Whereas for a dynamically stable
system the positions and velocities of the masses at time
t are changed only a little
if their initial conditions are slightly varied (e.g., by giving
one of the masses a slightly larger velocity), in a chaotic,
dynamically unstable system even tiny changes in the initial
conditions can lead to completely different states at later times.
Any N-body system with
N > 2 is dynamically
unstable.
Back to our three-body system. The three masses
may orbit around each other for an extended period of time, but
their gravitational interaction may then change the state of the
system suddenly, in that one of the three masses attains a
sufficiently high velocity relative to the other two and may escape
to infinity, whereas the other two masses form a binary system.
What was a bound system initially may become an unbound system
later on. This behavior may appear unphysical at first sight—where
does the energy come from to eject one of the stars? Is this
process violating energy conservation?
Of course not! The trick lies in the properties
of gravity: a binary has negative binding energy, and the more
negative, the tighter the binary orbit is. By three-body
interactions, the orbit of two masses can become tighter (one says
that the binary ‘hardens’), and the corresponding excess energy is
transferred to the third mass which may then become gravitationally
unbound. In fact, a single binary of compact stars can in principle
take up all the binding energy of a star cluster and ‘evaporate’
all other stars.

Fig. 2.51
The minimum velocity in the Galactic rest
frame is plotted against the distance from the Galactic center, for
a total of 37 stars. The star
symbols show hypervelocity stars, whereas circles are stars which are possibly on
gravitationally bound orbits in the Galaxy. The long- and short-dashed curves indicate the escape
velocity from the Milky Way, as a function of distance, according
to two different models for the total mass distribution in the
Galaxy. The dotted curves
indicate constant travel time of stars from the Galactic center to
a given distance with current space velocity, labeled by this time
in units of 106 yr. The distances are estimated assuming
that the stars are on the main sequence, whereas the error bars
indicate the plausible range of distances if these stars were on
the blue horizontal branch. Source: W.R. Brown, M.J. Geller &
S.J. Kenyon 2012, MMT
Hypervelocity Star Survey. II. Five New Unbound Stars, ApJ
751, 55, p. 5, Fig. 3. ©AAS. Reproduced with permission
This discussion then leads to the explanation of
hypervelocity stars. The characteristic escape velocity of the
‘third mass’ will be the orbital velocity of the three-body system
before the escape. The only place in our Milky Way where orbital
velocities are as high as that observed for the hypervelocity stars
is the Galactic center. In fact, the travel time of a star with
current velocity of ∼ 600 km∕s from the Galactic center to
Galacto-centric distances of ∼ 80 kpc is of order 108 yr
(see Fig. 2.51), slightly shorter than the main-sequence
lifetime of a B-star. Furthermore, most of the bright stars in the
central 1″ of the Galactic center region are B-stars. Therefore,
the immediate environment of the central black hole is the natural
origin for these hypervelocity stars. Indeed, long before their
discovery the existence of such stars was predicted. When a binary
system gets close to the black hole, this three-body interaction
can lead to the ejection of one of the two stars into an unbound
orbit, whereas the other star gets bound to the black hole. This is
considered the most plausible explanation for the presence of young
stars (like the B-stars of the S-star cluster) near to the black
hole. Thus, the existence of hypervelocity stars can be considered
as an additional piece of evidence for the presence of a central
black hole in our Galaxy.
For one of the hypervelocity stars, the time to
travel from the Galactic center to its current position is
estimated to be much longer than its main sequence lifetime, by a
factor of ∼ 3. Given that it is located just 16∘ away
from the Large Magellanic Cloud, it was suggested that it had been
ejected from there. However, for this star a proper motion was
measured with HST, and its direction is fully compatible with
coming from the Galactic center, ruling out an LMC origin.
Therefore, that star is not a main sequence star, but most likely a
so-called blue straggler.
The acceleration of hypervelocity stars near the
Galactic center may not be the only possible mechanism. Another
suggested origin can be related to the possible existence of
intermediate black holes with  , either at the
center of dense star clusters or as freely propagating in the Milky
Way, and may be the relics of earlier accretion events of low-mass
galaxies.
, either at the
center of dense star clusters or as freely propagating in the Milky
Way, and may be the relics of earlier accretion events of low-mass
galaxies.
, either at the
center of dense star clusters or as freely propagating in the Milky
Way, and may be the relics of earlier accretion events of low-mass
galaxies.Hypervelocity stars are not the only fastly
moving stars in the Milky Way, but there is a different population
of runaway stars. These stars are created through supernova
explosions in binaries. Let us consider a binary, in which the
heavier star (the primary) undergoes a supernova explosion,
possibly leaving behind a neutron star. During the explosion, the
star expels the largest fraction of its mass, on a time-scale that
is short compared to the orbital period of the binary, due to the
high expansion velocity. Thus, almost instantaneously, the system
is transformed into one where the primary star has lost most of its
mass. Given that the velocity of the secondary star did not change
through this process, thus being the orbital velocity corresponding
to the original binary, this velocity is now far larger than the
orbital velocity of the new binary. Therefore, the system of
secondary and the neutron star are no longer gravitationally bound,
and they will both separate, with a velocity similar to the
original orbital velocity. For close binaries, this can also exceed
100 km∕s, and is the origin of the high space velocities observed
for pulsars. However, these runaway stars can hardly be confused
with hypervelocity stars, since they are rare and are produced near
the Galactic disk.
2.7 Problems
2.1. Angular size of the Moon. The diameter of
the Moon is 3476 km, and its mean distance from Earth is about
385 000 km. Calculate the angular diameter of the Moon as seen on
the sky. What fraction of the full sky does the Moon cover?
2.2. Helium abundance from stellar evolution.
Assume that the baryonic matter M of a galaxy, such as the Milky Way,
consisted purely of hydrogen when it was formed. In this case, all
heavier elements must have formed from nuclear fusion in the
interior of its stellar population. Assume further that the total
luminosity L of the galaxy
is caused by burning hydrogen into helium, and let this luminosity
be constant over the total lifetime of the galaxy, here assumed to
be 1010 yr, with a correspondingly constant baryonic
mass-to-light ratio of  . What is the mass
fraction in helium that would be generated by the nuclear fusion
process? Would this fraction be large enough to explain the
observed helium abundance of ∼ 27 %?
. What is the mass
fraction in helium that would be generated by the nuclear fusion
process? Would this fraction be large enough to explain the
observed helium abundance of ∼ 27 %?
. What is the mass
fraction in helium that would be generated by the nuclear fusion
process? Would this fraction be large enough to explain the
observed helium abundance of ∼ 27 %?2.3. Flat rotation curve. We saw that the
rotation curve of the Milky Way is flat, V (R) ≈ const. Assume a
spherically-symmetric density distribution ρ(r). Determine the functional form of
ρ(r) which yields a flat rotation
curve.
2.4. The
Sun as a gravitational lens. What is the minimum distance a
Solar-like star needs to have from us in order to produce multiple
images of very distant sources, and how large would the achievable
image splitting be? Make use of the fact that the angular diameter
of the Sun is 32′ on average.
2.5. Kepler rotation around the Galactic center black
hole. We have mentioned that the Galactic center hosts a
star cluster with a characteristic velocity dispersion of ∼ 55 km∕s
at r ≳ 4 pc. How does this
velocity compare with the circular velocity of an object around the
central SMBH? Make use of the fact that  , the
so-called gravitational radius corresponding to a Solar mass.
, the
so-called gravitational radius corresponding to a Solar mass.
, the
so-called gravitational radius corresponding to a Solar mass.2.6. Superluminal motion through scattering.
Assume that there is a (infinitely thin) sheet of scattering
material between us and the Galactic center (GC). Let that screen
be perpendicular to the line-of-sight to the GC, and have a
distance D from the GC, so
that our distance to this screen is  . A light flash at the
GC will be seen in scattered light as a ring whose radius changes
in time. Calculate the radius R(t) of this ring, and determine its
apparent velocity dR∕dt. Can that be larger than the velocity
of light? Assume that the opening angle of the ring, as seen both
by the GC and by us, is small, so that R∕D ≪ 1, R∕D sc ≪ 1. Furthermore,
assume that the screen is close to the Galactic center, so that
D ≪ R 0. Can you get a similar
effect from a scattering screen behind the Galactic center?
. A light flash at the
GC will be seen in scattered light as a ring whose radius changes
in time. Calculate the radius R(t) of this ring, and determine its
apparent velocity dR∕dt. Can that be larger than the velocity
of light? Assume that the opening angle of the ring, as seen both
by the GC and by us, is small, so that R∕D ≪ 1, R∕D sc ≪ 1. Furthermore,
assume that the screen is close to the Galactic center, so that
D ≪ R 0. Can you get a similar
effect from a scattering screen behind the Galactic center?Footnotes
1
The equatorial coordinates are defined by the
direction of the Earth’s rotation axis and by the rotation of the
Earth. The intersections of the Earth’s axis and the sphere define
the northern and southern poles. The great circles on the sphere
through these two poles, the meridians, are curves of constant
right ascension α. Curves
perpendicular to them and parallel to the projection of the Earth’s
equator onto the sky are curves of constant declination δ, with the poles located
at δ = ±90∘.
2
In general, since the star also has a spatial
velocity different from that of the Sun, the ellipse is superposed
on a linear track on the sky; this linear motion is called
proper motion and will be
discussed below.
3
To be precise, the Earth’s orbit is an ellipse,
and one astronomical unit is its semi-major axis, being
1 AU = 1. 496 × 1013 cm.
5
With what we have just learned we can readily
answer the question of why the sky is blue and the setting Sun
red.
6
This notation scheme (Type Ia, Type II, and so
on) is characteristic for phenomena that one wishes to classify
upon discovery, but for which no physical interpretation is
available at that time. Other examples are the spectral classes of
stars which are not named in alphabetical order nor according to
their mass on the main sequence; or the division of Seyfert
galaxies into Type 1 and Type 2. Once such a notation is
established, it often becomes permanent even if a later physical
understanding of the phenomenon suggests a more meaningful
classification.
7
Pulsars are sources which show a very regular periodic radiation, most
often seen at radio frequencies. Their periods lie in the range
from ∼ 10−3 s (milli-second pulsars) to ∼ 5 s. Their
pulse period is identified as the rotational period of the neutron
star—an object with about one Solar mass and a radius of ∼ 10 km.
The matter density in neutron stars is about the same as that in
atomic nuclei.
8
The name of a supernova is composed of the year
of explosion, and a single capital letter or two lower case
letters. The first detected supernova in a year gets the letter
‘A’, the second ‘B’ and so on; the 27th then obtains an ‘aa’, the
28th an ‘ab’ etc. Hence, SN 1987A was the first one discovered in
1987.
9
Hii-regions are nearly spherical
regions of fully ionized hydrogen (thus the name Hii region) surrounding a young hot
star which photoionizes the gas. They emit strong emission lines of
which the Balmer lines of hydrogen are strongest.
10
These energies should be compared with those
reached in particle accelerators: the LHC at CERN
reaches ∼ 10 TeV = 1013 eV. Hence, cosmic accelerators
are much more efficient than man-made machines.
11
Shock fronts are surfaces in a gas flow where the
parameters of state for the gas, such as pressure, density, and
temperature, change discontinuously. The standard example for a
shock front is the bang in an explosion, where a spherical shock
wave propagates outwards from the point of explosion. Another
example is the sonic boom caused, for example, by airplanes that
move at a speed exceeding the velocity of sound. Such shock fronts
are solutions of the hydrodynamic equations. They occur frequently
in astrophysics, e.g., in explosion phenomena such as supernovae or
in rapid (i.e., supersonic) flows such as those we will discuss in
the context of AGNs.
12
The Pierre Auger Observatory in Argentina
combines 1600 surface detectors for the detection of particles from
air showers, generated by cosmic rays hitting the atmosphere, with
24 optical telescopes measuring the optical light produced by these
air showers. The detectors are spread over an area of
3000 km2, with a spacing between detectors of 1. 5 km,
small enough to resolve the structure of air showers which is
needed to determine the direction of the incoming cosmic ray.
Starting regular observations in 2004, Auger has already led to
breakthroughs in cosmic ray research.
13
In addition to the two-photon annihilation, there
is also an annihilation channel in which three photons are
produced; the corresponding radiation forms a continuum spectrum,
i.e., no spectral lines.
14
The determinant in (2.86) is a generalization
of the derivative in one spatial dimension to higher dimensional
mappings. Consider a scalar mapping y = y(x); through this mapping, a ‘small’
interval Δ x is mapped onto
a small interval Δ y, where
Δ y ≈ (dy∕dx) Δ
x. The Jacobian determinant occurring in (2.86) generalizes this
result to a two-dimensional mapping from the lens plane to the
source plane.
16
These parallax events in addition prove that the
Earth is in fact orbiting around the Sun—even though this is not
really a new insight….
17
Masers are regions of stimulated non-thermal
emission which show a very high surface brightness. The maser
phenomenon is similar to that of lasers, except that the former
radiate in the microwave regime of the spectrum. Masers are
sometimes found in the atmospheres of active stars.
18
One problem in the combined analysis of data
taken in different wavelength bands is that astrometry in each
individual wavelength band can be performed with a very high
precision—e.g., individually in the radio and the IR band—however,
the relative astrometry between these bands is less well known. To
stack maps of different wavelengths precisely ‘on top of each
other’, knowledge of exact relative astrometry is essential. This
can be gained if a population of compact sources exists that is
observable in both wavelength domains and for which accurate
positions can be measured.